
|
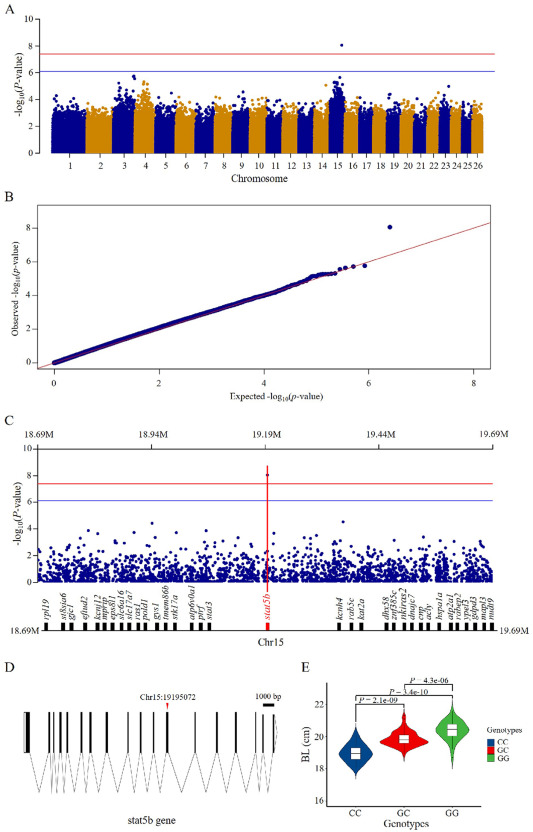
Fig. 2 GWASanalysis for body length in female yellow catfish. (A) Manhattan plot of GWAS for body length generated from MLM. The red solid line indicates the threshold level (−log10(3.97E−8)) for genome-wide significance. The blue solid line indicates the threshold level (−log10(7.94E−7)) for significance of suggestive association. (B) Quantile-Quantile (Q-Q) plot of the GWAS for body length. (C) Genes within ±0.5 Mb of the significant locus Chr15:19195072 that is associated with body length. The red vertical line indicates the associated locus. The red horizontal line indicates the threshold P value for genome-wide significance. The blue horizontal line indicates the threshold P value for significance of suggestive association. Growth-related genes are highlighted in red. (D) Schematic diagram of genomic DNA information and candidate SNP in stat5b gene of yellow catfish. (E) Statistical comparison between body length and three genotypes of the SNP Chr15:19195072 (G/C). (For interpretation of the references to colour in this figure legend, the reader is referred to the web version of this article.)