
|
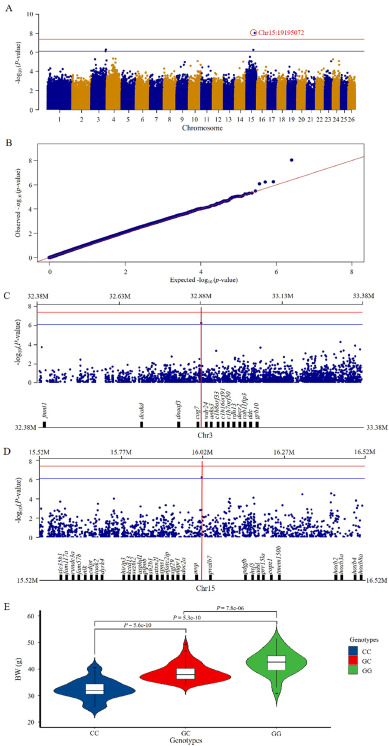
Fig. 3
GWAS analysis for body weight in female yellow catfish. (A) Manhattan plot of genome-wide association analysis for body weight generated from MLM. The red solid line indicates the threshold level (−log10(3.97E-8)) for genome-wide significance. The blue solid line indicates the threshold level (−log10(7.94E-7)) for significance of suggestive association. (B) Quantile-Quantile (Q-Q) plot of the GWAS for body weight. (C D) Genes within ±0.5 Mb of the suggestive loci associated with body weight on Chr3 and Chr15. The red vertical line indicates the associated locus. The red horizontal line indicates the threshold P value for genome-wide significance. The blue horizontal line indicates the threshold P value for significance of suggestive association. (E) Statistical comparison between body weight and three genotypes of the SNP Chr15:19195072 (G/C). (For interpretation of the references to colour in this figure legend, the reader is referred to the web version of this article.)