
Image
|
Figure Caption
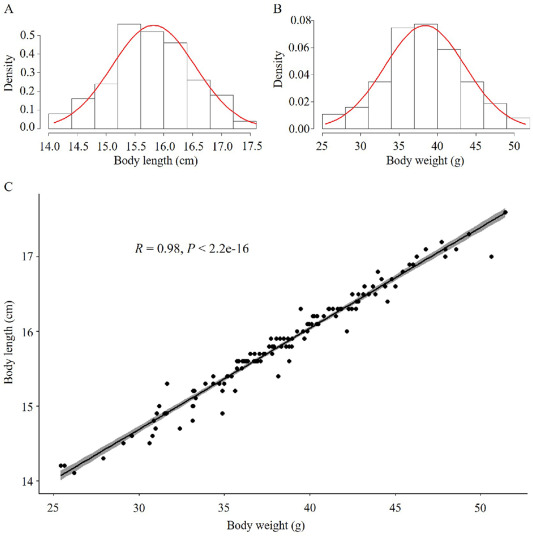
Fig. 1 The distribution and correlation analysis of phenotypic data in female yellow catfish. Normal distribution of body length (A) and body weight (B) of the test female yellow catfish at 6-month-old. (C) Simple linear regression analysis of the relation between body length and body weight. (For interpretation of the references to colour in this figure legend, the reader is referred to the web version of this article.)
Acknowledgments
This image is the copyrighted work of the attributed author or publisher, and
ZFIN has permission only to display this image to its users.
Additional permissions should be obtained from the applicable author or publisher of the image.
Full text @ Genomics