
Fig. 3
- ID
- ZDB-FIG-230519-43
- Publication
- Huang et al., 2022 - Genome-wide association study reveals the genetic basis of growth trait in yellow catfish with sexual size dimorphism
- Other Figures
- All Figure Page
- Back to All Figure Page
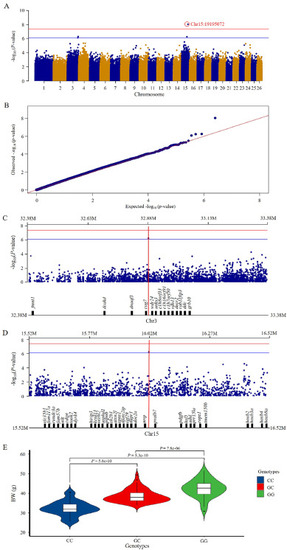
GWAS analysis for body weight in female yellow catfish. (A) Manhattan plot of genome-wide association analysis for body weight generated from MLM. The red solid line indicates the threshold level (−log10(3.97E-8)) for genome-wide significance. The blue solid line indicates the threshold level (−log10(7.94E-7)) for significance of suggestive association. (B) Quantile-Quantile (Q-Q) plot of the GWAS for body weight. (C |
 D) Genes within ±0.5 Mb of the suggestive loci associated with body weight on Chr3 and Chr15. The red vertical line indicates the associated locus. The red horizontal line indicates the threshold P value for genome-wide significance. The blue horizontal line indicates the threshold P