
- Title
-
Abnormal male reproduction and embryonic development induced by downregulation of a phospholipid fatty acid-introducing enzyme Lpgat1 in zebrafish
- Authors
- Shibata, T., Kawana, H., Nishino, Y., Ito, Y., Sato, H., Onishi, H., Kano, K., Inoue, A., Taketomi, Y., Murakami, M., Kofuji, S., Nishina, H., Miyazawa, A., Kono, N., Aoki, J.
- Source
- Full text @ Sci. Rep.

ZFIN is incorporating published figure images and captions as part of an ongoing project. Figures from some publications have not yet been curated, or are not available for display because of copyright restrictions. |

Generation of |
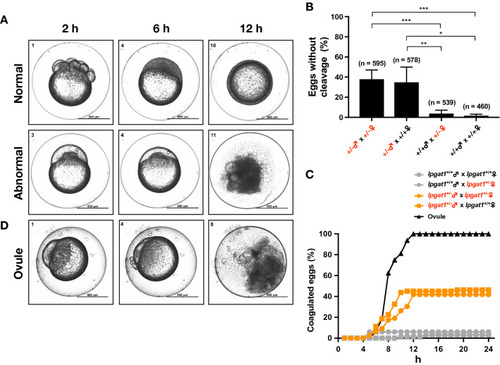
PHENOTYPE:
|
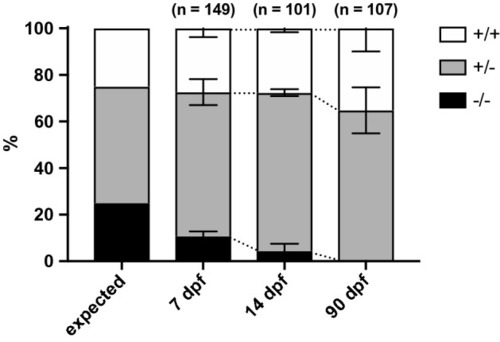
PHENOTYPE:
|
|
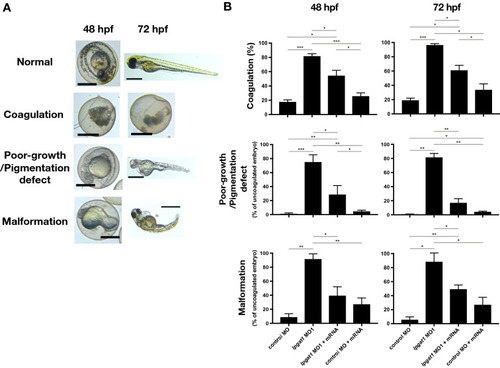
Downregulation of PHENOTYPE:
|
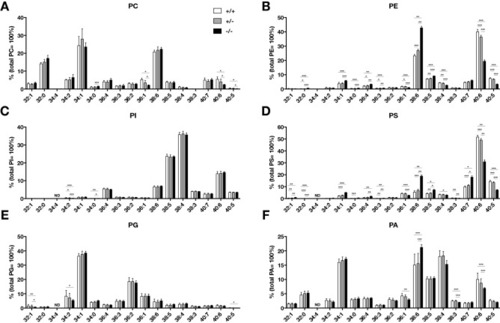

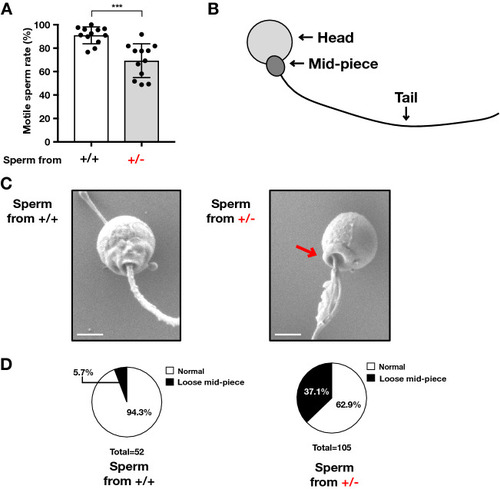
Phosphatidylcholine (PC) and phosphatidylethanolamine (PE) species in sperm from PHENOTYPE:
|