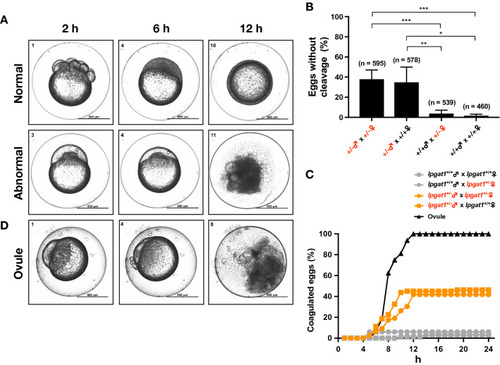
lpgat1+/− male zebrafish exhibited a reproductive defect. (A) Representative images of abnormal eggs resulting from crossing between lpgat1+/− male and wild-type female. The abnormal eggs showed no signs of cell division and, over time, became coagulated. The results from mutant 1 are shown. The elapsed time after mating is indicated at the top of the panels. Zen Pro software (Zeiss) was used to process the images. Scale bar, 500 µm. (B) Percentage of eggs with no sign of cell division at 6 hpf. Results from the crossing between the indicated genotypes are shown. For mutants 1 and 2, four genotype combinations of crosses (lpgat1+/+ males/lpgat1+/+ females, lpgat1+/− males/lpgat1+/+ females, lpgat1+/+ males/lpgat1+/− females and lpgat1+/− males/lpgat1+/− females) were performed for four times each and the results of the same genotype combination were combined. The numbers of eggs analyzed are indicated on the top of each bar. Error bars are S.D. Statistically significant differences are marked with asterisk. *p < 0.05; **p < 0.01, ***p < 0.001. Two-way ANOVA, Holm’s multiple comparison test was used. (C) Percentage of coagulated eggs overtime after mating. Results from the crossing between the indicated genotypes are shown. Crossing were performed for four times each. Representative data using mutant 1 are shown. Eighty eggs were buried in an agarose gel and evaluated based on the images by time-lapse observation. The result from ovules (unfertilized eggs) is also shown. (D) Representative images of ovules (unfertilized eggs) squeezed out of a wild-type female over time. Note that they showed no signs of cell division and, over time, became coagulated as in (A, lower). The elapsed time after the eggs were squeezed out is indicated at the top of the panel. Scale bar, 500 µm.
|
