FIGURE SUMMARY
Title

Promoter Binding and Nuclear Retention Features of Zebrafish IRF Family Members in IFN Response

Authors
An, L.L., Zhao, X., Gong, X.Y., Li, Y.L., Qu, Z.L., Sun, H.Y., Guo, W.H., Dan, C., Gui, J.F., Zhang, Y.B.
Source
Full text @ Front Immunol

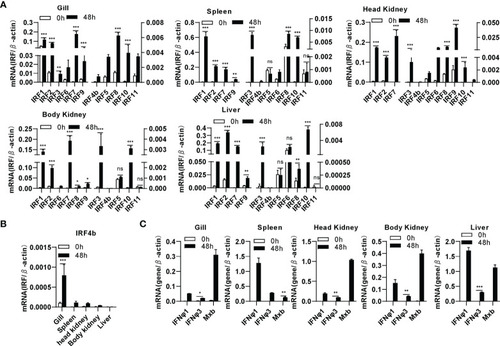
Zebrafish IRF family genes are transcriptionally induced in zebrafish tissues by SVCV infection. zebrafish adults were intraperitoneally injected with SVCV virus of 1×10⁷ TCID50/ml (25μL/fish). 48h later, five tissues, including gill, spleen, head kidney, body kidney, and liver, were sampled for extraction of total RNAs followed by qRT-PCR analyses of 11 zebrafish IRF family genes (A), zebrafish IRF4b (B), and zebrafish IFNφ1, IFNφ3 and Mxb (C). The relative expression values of a given gene were normalized to β-actin in the same sample. Error bars represent SDs obtained by measuring each sample in triplicate. (***P < 0.001, **P < 0.01, *P < 0.05, ns, no significant).

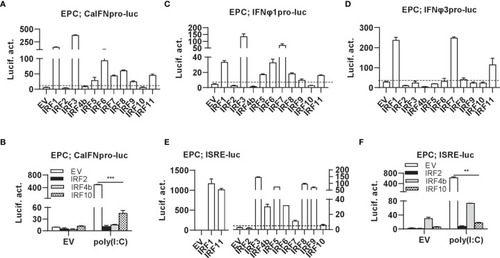
Zebrafish IRF proteins are capable to regulate fish IFN response. (A) overexpression of zebrafish IRF proteins regulate the activation of crucian carp IFN promoter. EPC cells seeded in 48-well plates overnight were transfected with CaIFNpro-luc (100 ng), each of zebrafish IRF plasmids (100 ng) and pRL-TK (10 ng). The control cells were transfected with pEGFP-N3 (EV) instead of IRF plasmid. 30h later, cells were harvested for luciferase assays. (B) overexpression of zebrafish IRF2/4b/10 inhibits poly(I:C)-triggered activation of crucian carp IFN promoter. EPC cells seeded in 48-well plates overnight were transfected with CaIFNpro-luc (100 ng), each of zebrafish IRF2/4b/10 (100 ng), pRL-TK (10 ng) and poly(I:C) (1 ug/ml) for 30h, followed by luciferase assays. (C–E) overexpression of zebrafish IRF proteins regulate the activation of zebrafish IFNφ1 promoter (C), IFNφ3 promoter (D), and ISRE-containing promoter (E). EPC cells were transfected as in (A) with IFNφ1pro-luc (C), IFNφ3pro-luc (D), or ISRE-luc (E). (F) overexpression of zebrafish IRF2/4b/10 inhibits poly(I:C)-triggered activation of ISRE-containing promoter. EPC cells were transfected as in (B) with ISRE-luc instead of CaIFNpro-luc. The dashed line indicates the basic stimulatory effect of empty vector on IFN promoter activation. The data shown were representative of three independent experiments. (***P < 0.001, **P < 0.01).

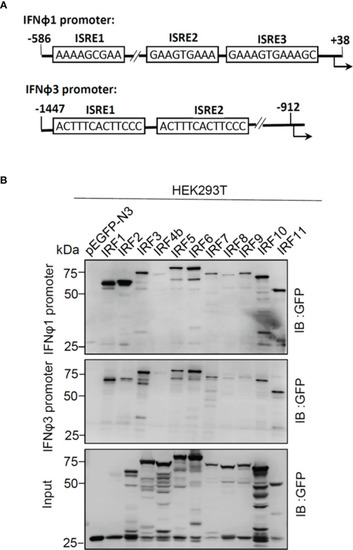
Zebrafish IRF proteins bind to zebrafish promoter DNA. (A) Schematic diagram of zebrafish IFNφ1 and IFNφ3 promoters, showing the position and sequence of potential ISRE/IRF-E motifs. (B) The binding of zebrafish IRF proteins to zebrafish IFN promoter DNA. The biotin-labeled DrIFNφ1 (-586 to +38) or DrIFNφ3 (-1447 to -910) promoter DNA (20 ng each) was incubated with the excessive amounts of zebrafish IRF proteins, or with GFP as control. Zebrafish IRF and GFP proteins were derived from the lysates of HEK293T cells that had been transfected for 30h with plasmids expressing zebrafish IRF protein fused to GFP or pEGFP-N3, respectively. One-tenth of cell lysates were taken as input. The bead-bound DNA-protein complex was detected by the Ab specific to the GFP tag using Western blotting.

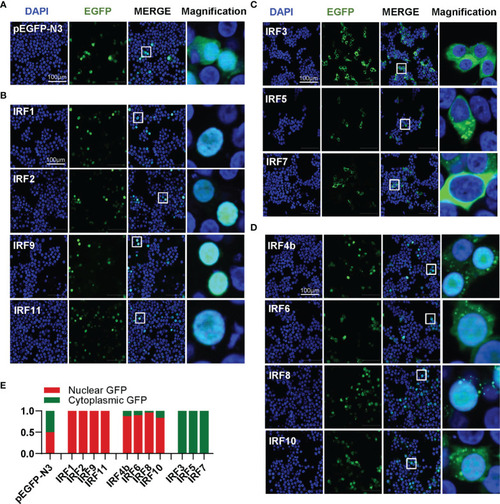
Zebrafish IRF family members show three patterns of constitutively subcellular localization. (A–D) Confocal microscopy illuminates the subcellular localization of zebrafish IRF proteins. HEK293T cells seeded on microscope slide cover glasses overnight in six-well plates were transiently transfected with pEGFP-N3 as control (A), or with each of GFP-fused IRF1/2/9/11 constructs (B), or with each of GFP-fused IRF3/5/7 constructs (C), or with each of GFP-fused IRF4b/6/8/10 (2μg each). At 24 h post transfection, cells were fixed and examined using a confocal microscopy. DAPI staining showed the nuclei. The last column showed magnification view of the area highlighted in the box. (E) The intensities of nucleus/cytoplasm GFP were quantitated by the ImageJ processing program followed by normalization to that of pEGFP-N3, which was set to 1:1.

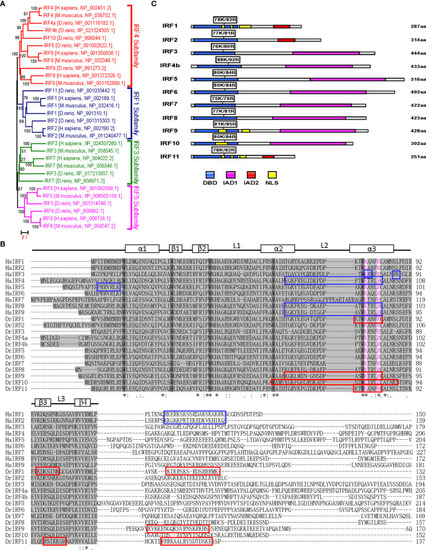
Figure 5 K78 and R82 of α3 helices in DBD domain of IRF11 are conserved across IRF family members. (A) Phylogenetic tree analysis of zebrafish and human IRF family members showing four IRF subfamilies. The phylogenetic tree was constructed by a neighbor-joining method in MEGA 5.0. The bootstrap confidence values shown at the nodes are based on 1000 bootstrap replications. (B) Multiple alignments of zebrafish IRF proteins showing a highly conserved DBD and the distribution of NLS motifs identified previously. DBD domains are gray with five conserved tryptophans. The symbols, including α-helices, β-strands and loops, indicates the secondary structures of DBD, which are marked by rectangle and line. Based on publications, the identified NLS motifs of zebrafish IRF1/10/11 are indicated by red boxes, and the NLS motifs of human IRF1/2/3/4/5/8/9 in blue boxes. Zebrafish IRF11 has a tripartite NLS motif composed of NLS1, NLS2 and NLS3, with the conserved K78 and R82 that are highlighted in purple. Identical (*) and similar (: or.) amino acid residues are indicated. (C) Schematic diagram of zebrafish IRF proteins, showing the position of two conserved basic residues corresponding to K78 and R82 of zebrafish IRF11. All mutants of zebrafish IRF protein were generated by combined mutation of the corresponding two residues to alanine.

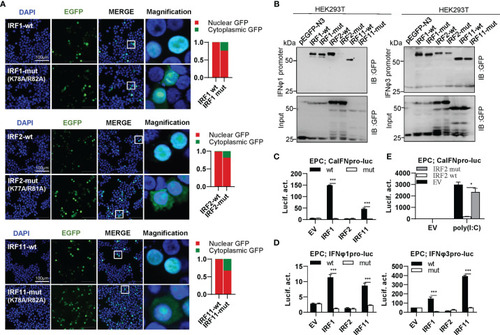
The two basic residues are essential for IRF1/2/11 to regulate IFN response. (A) Mutation of the two basic residues impaired the constitutively nuclear accumulation of IRF1/2/11. Left panels: HEK293T cells seeded overnight on microscope slide cover-glasses in six-well plates were transiently transfected as in Figure 4, with indicated IRF plasmids (2μg each) for 24h, followed by confocal microscopy examination. The last column showed magnification view of the area highlighted in the box. Right panels: The intensities of nucleus/cytoplasm GFP were quantitated using the ImageJ processing program and normalized to that of the empty construct pEGFP-N3, which was set to 1:1. (B) Pull-down analysis of the binding affinity of IRF1/2/11 wild types and IRF1/2/11 mutants to IFNφ1/IFNφ3 promoters. DNA pull-down assays were performed as in Figure 3B, by incubating biotin-labeled IFNφ1 or IFNφ3 promoter DNAs with appropriate amounts of HEK293T cell lysates, where cells were transfected for 30h with wild types or mutants of IRF1/2/11, respectively. (C, D) IRF1/11 mutants failed to stimulate the activation of crucian carp IFN promoter (C), and zebrafish IFNφ1/IFNφ3 promoters (D). EPC cells seeded in 48-well plates overnight were transfected with CaIFNpro-luc (C), IFNφ1pro-luc or IFNφ3pro-luc (D), together with the indicated IRF plasmids (100ng each) for 30 h, followed by luciferase assays. (E) IRF2 mutant failed to inhibit poly(I:C)-triggered activation of crucian carp IFN promoter by luciferase assays. EPC cells were transfected with the indicated plasmids (100ng each), together with poly(I:C) (1μg/ml) for 30h. (***P < 0.001, *P < 0.05).

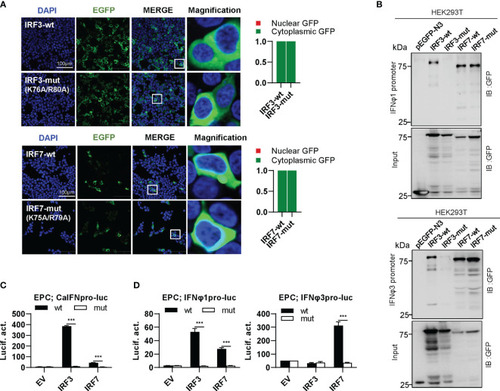
The two basic residues are essential for IRF3/7 to stimulate IFN response. (A) Mutation of two residues did not change the constitutively nuclear accumulation of IRF3/7. Left panels: HEK293T cells seeded overnight on microscope slide cover-glasses in six-well plates were transiently transfected as in Figure 4, with indicated plasmids (2μg each) for 24h, followed by confocal microscopy examination. The last column showed magnification view of the area highlighted in the box. Right panels: The intensities of nucleus/cytoplasm GFP were quantitated using the ImageJ processing program and normalized to that of the empty construct pEGFP-N3, which was set to 1:1. (B) Pull-down analysis of the binding affinity of wild types and mutants of IRF3/7 to IFNφ1/IFNφ3 promoters. DNA pull-down assays were performed as in Figure 3B, by incubation of biotin-labeled IFNφ1 or IFNφ3 promoter DNA with appropriate amounts of HEK293T cell lysates, where cells were transfected for 30h with wild types or mutants of IRF3/7, respectively. (C, D) IRF3/7 mutants failed to stimulate the activation of crucian carp IFN promoter (C), and zebrafish IFNφ1/IFNφ3 promoters (D). EPC cells seeded in 48-well plates overnight were transfected with CaIFNpro-luc (C), IFNφ1pro-luc or IFNφ3pro-luc (D), together with the indicated IRF plasmids (100ng each). 30 h later, cells were harvested for luciferase assays. (***P < 0.001).

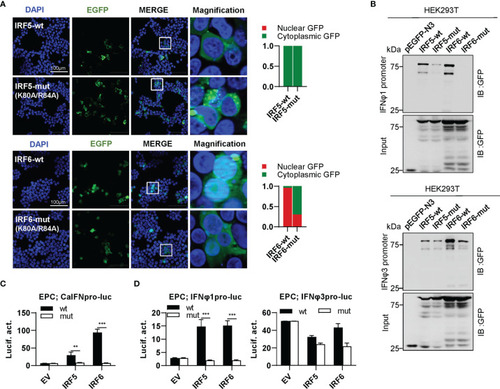
The two basic residues are essential for IRF5/6 to regulate IFN response. (A) Mutation of the two residues impaired the constitutively nuclear accumulation of IRF6 but not of IRF5. Left panels: HEK293T cells seeded overnight on microscope slide cover-glasses in six-well plates were transiently transfected as in Figure 4, with indicated plasmids (2μg each) for 24h, followed by confocal microscopy examination. The last column showed magnification view of the area highlighted in the box. Right panels: The intensities of nucleus/cytoplasm GFP were quantitated using the ImageJ processing program and normalized to that of the empty construct pEGFP-N3, which was set to 1:1. (B) Pull-down analysis of the binding affinity of wild types and mutants of IRF5/6 to IFNφ1/IFNφ3 promoters. DNA pull-down assays were performed as in Figure 3B, by incubating biotin-labeled IFNφ1 or IFNφ3 promoter DNA with appropriate amounts of HEK293T cell lysates, where cells were transfected for 30h with wild types or mutants of IRF5/6, respectively. (C, D). IRF5/6 mutants failed to stimulate the activation of crucian carp IFN promoter (C), and zebrafish IFNφ1/IFNφ3 promoters (D). EPC cells seeded in 48-well plates overnight were transfected with CaIFNpro-luc (C), IFNφ1pro-luc or IFNφ3pro-luc (D), together with the indicated IRF plasmids (100ng each). 30h later, cells were harvested for luciferase assays. (***P < 0.001; **P < 0.01).

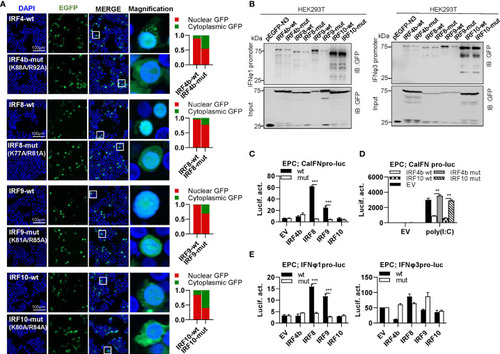
The two basic residues are essential for IRF4b/8/9/10 to regulate IFN response. (A) Mutation of the two basic residues impaired the constitutively nuclear accumulation of IRF4b/8/9/10. Left panels: HEK293T cells seeded overnight on microscope slide cover-glasses in six-well plates were transiently transfected as in Figure 4, with indicated plasmids (2μg each) for 24h, followed by confocal microscopy examination. The last column showed magnification view of the area highlighted in the box. Right panels: The intensities of nucleus/cytoplasm GFP were quantitated using the ImageJ processing program and normalized to that of the empty construct pEGFP-N3, which was set to 1:1. (B) Pull-down analysis of the binding affinity of wild types and mutants of IRF4b/8/9/10 to IFNφ1/IFNφ3 promoters. DNA pull-down assays were performed as in Figure 3B, by incubating biotin-labeled IFNφ1 or IFNφ3 promoter DNAs with appropriate amounts of HEK293T cell lysates, where cells were transfected for 30h with wild types or mutants of IRF4b/8/9/10, respectively. (C) IRF8/9 mutants failed to stimulate the activation of crucian carp IFN promoter. EPC cells seeded in 48-well plates overnight were transfected for 30h with CaIFNpro-luc, together with the indicated IRF plasmids (100ng each). (D) IRF4b/10 mutant failed to inhibit poly(I:C)-triggered activation of crucian carp IFN promoter. EPC cells were transfected with the indicated plasmids (100ng each), together with poly(I:C) (1μg/ml) for 30h. (E) IRF8/9 mutants failed to stimulate the activation of zebrafish IFNφ1/IFNφ3 promoters. EPC cells were transfected with IFNφ1pro-luc or IFNφ3pro-luc, together with the indicated IRF plasmids (100ng each). 30 h later, cells were harvested for luciferase assays. (***P < 0.001, **P < 0.01).

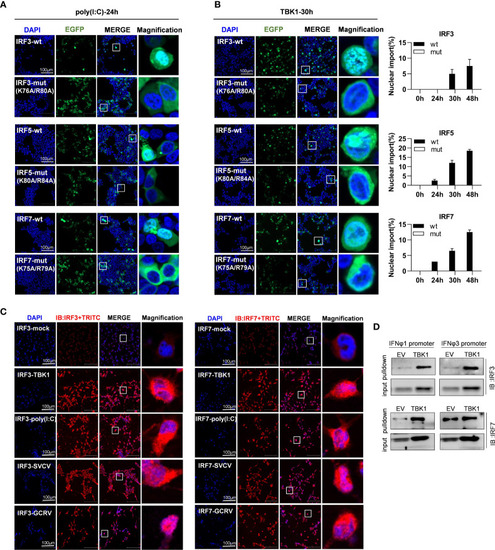
The two basic residues are essential for inducible nuclear import of IRF3/5/7 by transfection of poly(I:C) (A) and TBK1 (B). (A) Mutation of the two basic residues impaired the inducible nuclear import of IRF3/5/7 by poly(I:C) transfection. HEK293T cells seeded overnight on microscope slide cover-glasses in six-well plates were transiently cotransfected as in Figure 4 for 24h, with the indicated IRF plasmids (2μg each) and poly(I:C) (100ng/ml). (B) Mutation of the two basic residues impaired the nuclear import of IRF3/5/7 by overexpression of TBK1. HEK293T cells seeded overnight on microscope slide cover-glasses were transiently transfected as in Figure 4, with the indicated IRF plasmids and TBK1 (2μg each) for different time points (24, 30, 48h), followed by a time-course confocal microscopy examination. Left panels showed the representative images at 30h post transfection. Right panels: The ratio of the nuclear-translocated cells to total fluorescent cells was statistically quantitated by cell counting of the whole visual field under confocal microscopy. (C) Immunofluorescence microscopy observation of endogenous IRF3 and IRF7 proteins in cells with or without stimulation by IFN stimuli. CO cells seeded overnight on microscope slide cover-glasses were transiently transfected with TBK1 (2 μg) or poly(I:C) (100ng/ml or infected wit SVCV or GCRV(1×10³ TCID50/ml each), or mock treatment as control. 24h later, the cells were fixed, incubated overnight with polyclonal antibodies of fish IRF3 and IRF7, stained with fluorescent secondary antibody (Alexa Fluor Plus 555 TRITC). Red signal indicated endogenous IRF3 and IRF7 proteins. An enlarged view of the highlighted area in the last column display box. (D) Pull-down analysis of the binding affinity of Endogenous IRF3 and IRF7 proteins to fish promoter DNA. CO cells seeded overnight in 10cm2 dishes were transfected with TBK1 or empty vector (5μg each) for 30h. The biotin-labeled DrIFNφ1 (-586 to +38) or DrIFNφ3 (-1447 to -910) promoter DNA (30 ng each) was incubated with the transfected cell lysates overnight at 4°C, followed by western blotting to detect IRF3 and IRF7 proteins by fish antibodies specific to IRF3 and IRF7. Note: the low binding intensities in empty vector-transfected CO cells might be due to the low level of constitutive expressed IRF3 and IRF7, which finally resulted in unsaturated protein binding to DNA in the pulldown assays.

Acknowledgments
This image is the copyrighted work of the attributed author or publisher, and ZFIN has permission only to display this image to its users. Additional permissions should be obtained from the applicable author or publisher of the image. Full text @ Front Immunol