FIGURE SUMMARY
Title

Exploring Zebrafish Larvae as a COVID-19 Model: Probable Abortive SARS-CoV-2 Replication in the Swim Bladder

Authors
Laghi, V., Rezelj, V., Boucontet, L., Frétaud, M., Da Costa, B., Boudinot, P., Salinas, I., Lutfalla, G., Vignuzzi, M., Levraud, J.P.
Source
Full text @ Front Cell Infect Microbiol

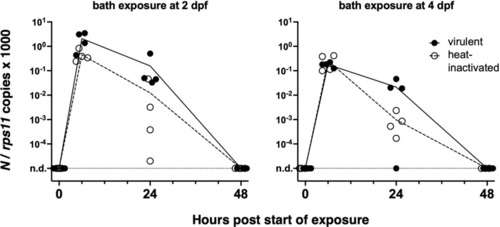
Bath exposure of zebrafish larvae to SARS-CoV-2. Kinetics of qRT-PCR measurements of polyadenylated viral N copies; each point corresponds to an individual larva. n.d., not detected.

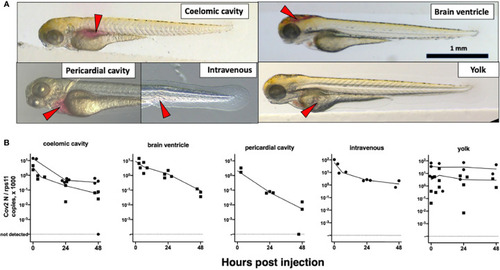
Microinjection of SARS-CoV-2 to 3-dpf wild-type larvae. (A) Illustrations of the targeted sites. Images taken less than 1 min after injection of the phenol red-colored SARS-CoV-2 suspension. Red arrowheads point to the sites of microinjection. (B) Quantification of polyadenylated N transcripts over time, assessed by qRT-PCR; each symbol is an individual larva. Circles and squares correspond to injection of viral suspensions 1 and 2, as labeled on Table 1, respectively. Lines connect the means of values measured at each time point.

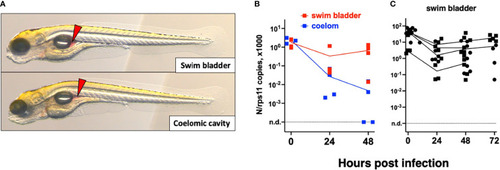
Microinjection of SARS-CoV-2 to 4-dpf larvae. (A) Illustrations of injection in the posterior end of the swim bladder or in the coelomic cavity. (B, C) Quantification of polyadenylated N transcripts over time, assessed by qRT-PCR; each symbol is an individual larva. (B) Comparison of swim bladder (red) and coelom (blue) injection in a single experiment. (C) Four more swim bladder injection experiments. Lines connect the means of values measured at each time point. Circles and squares correspond to injection of viral suspensions 1 and 2, as labeled on Table 1.

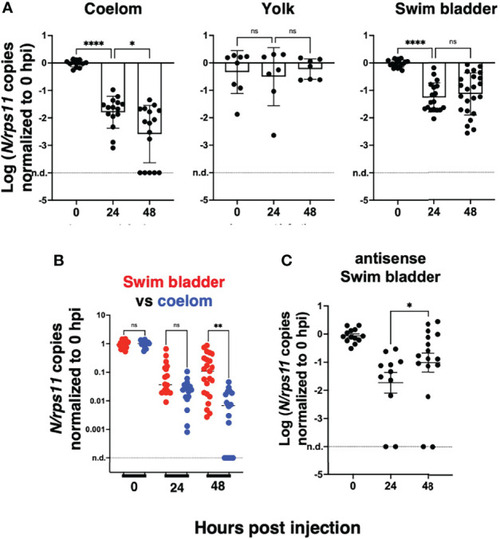
Statistical analysis of viral transcript quantifications, after normalization to the means of values measured at 0 hpi for each experiment. (A) Comparison of SARS-CoV-2 RNA loads over time in each microinjection location; ANOVA analysis of log-transformed values, not assuming equal SDs (Brown–Forsythe test with Dunn’s correction). Results pooled from four, two, and five experiments for coelom, yolk, and swim bladder injections, respectively. (B) Comparison of coelom and swim bladder injections at each time point; non-parametric multiple comparisons of non-transformed values (Kruskal–Wallis test with Dunn’s correction). (C) Comparison of antisense transcripts in the swim bladder, log-transformed values, Mann–Whitney test, pooled from three experiments. ns, not significant; *p < 0.05; **p < 0.01; ****p < 0.0001.

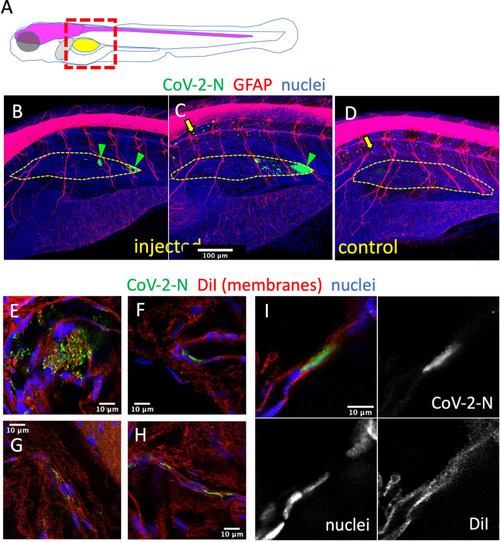
Immunodetection of infected cells in the swim bladder. (A) Scheme of the imaged region: the swim bladder is shown in yellow, the brain and spinal cord in magenta, the liver in gray. (B–F) Confocal images of SARS-CoV-2-injected (B, C, E–I) or uninjected (D) larvae fixed at 2 dpi and subjected to whole-mount immunohistochemistry with an anti-CoV-2-N antibody (green), an anti-GFAP antibody (red in B–D) or membranes stained by DiI (red in E–I), and stained nuclei (blue). (B–D) Maximal projections. The approximate contours of the partially collapsed swim bladders are shown with a dotted yellow line. N-positive cells shown with green arrowheads. Yellow arrows point to non-specific punctate signal in the notochord. (E–I) Single confocal planes.

EXPRESSION / LABELING:
Antibodies:
Fish:
Anatomical Terms:
Stage: Day 6

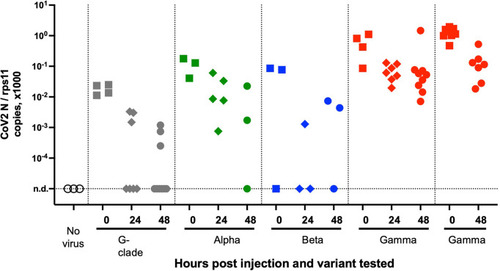
Testing SARS-CoV-2 variants. qRT-PCR analysis of larvae at various times after injection of 2 nl of virus suspension in the swim bladder. Dotted lines separate independent experiments.

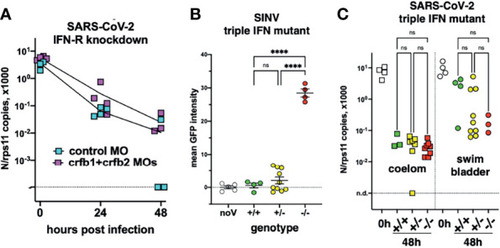
Viral infection in IFN-defective larvae. (A) IFN-receptor (crfb1 and crfb2 genes) or control morphants infected at 3 dpf in the coelomic cavity; qRT-PCR. (B, C) Offspring from an incross of heterozygous triple IFN-mutants. (B) Larvae injected with SINV-GFP IV at 3 dpf, analyzed by fluorescence imaging at 48 hpi. (C) Larvae injected with SARS-CoV-2, either at 3 dpf in the coelom or at 4 dpf in the swim bladder; analyzed by qRT-PCR at 0 or 48 hpi. Statistical analysis by ordinary 1-way ANOVA in (B), by Kruskal–Wallis test in (C). ns, not significant; ****p < 0.0001.

Host response after SARS-CoV-2 injection in the swim bladder. qRT-PCR, pool of 4 independent experiments (except for ccl19a.1 and ccl20a.3, 3 and 2 experiments respectively). Numbers on the X-axis refer to hours postinjection; noV (for “no Virus”): pooled uninjected negative controls, age-matched to 24, 48, or 72 hpi. One-way ANOVA analysis. ns, not significant.

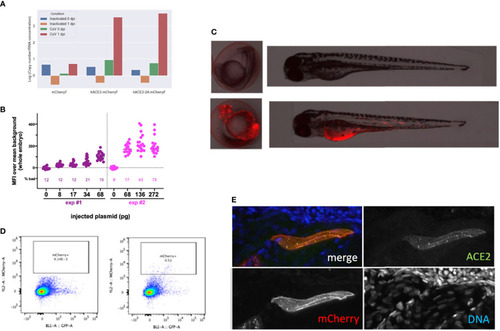
Overexpression of hACE2-mCherry by plasmid injection at the 1-cell stage. (A) Verification of construct functionality by transfection in BHK cells. N mRNA levels measured 24 h after exposure of transfected cells with inactivated or with active SARS-CoV-2. (B) Optimization of the plasmid dose. Fluorescence intensity measured in 24-hpf embryos after injection at the 1-cell stage of the specified amount of the pz26hACE2-mCherryF plasmid together I-SceI, for the 25% embryos with the best expression in each group. The percentage of misshapen embryos in each group is indicated on the bottom of the graph. (C) representative image of a 24-hpf embryo (left) and a 3-dpf larva (right) after mock injection (top) or injection of 68 pg of pz26hACE2-mCherryF. (D) Representative flow cytometry analysis of cells dissociated from 4-dpf larvae, mock-injected (left) or injected with 68 pg of pz26hACE2-mCherryF (right). (E) Immunohistochemistry of a larva injected with 68 pg of pz26hACE2-2A-mCherryF, showing ACE2 detection of a mCherry-positive muscle fiber.

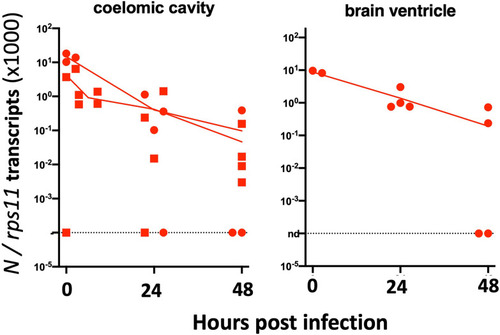
Injection of 3-dpf hACE2-mCherry mosaic larvae. Quantification of sense N transcripts in individual hACE2-mCherry mosaic larvae injected in coelomic cavity (left; one experiment with hACE2-mCherry, one with hACE2-2A-mCherry) or brain ventricle (right; with hACE2-2A-mCherry) by qRT-PCR.

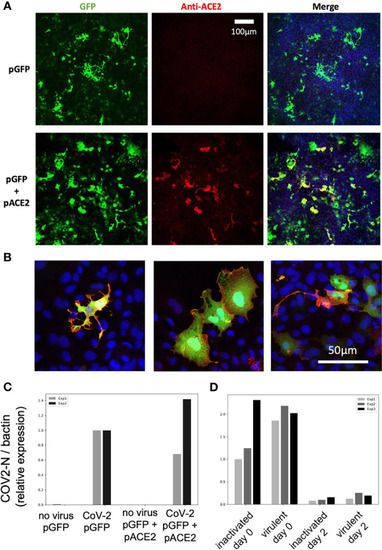
SARS-CoV-2 does not replicate on EPC cells transfected with human ACE2. (A, B) Confocal microscopic images of EPC cells cultures 3 days after transfection. (A) Assessment of transfection efficiency at low magnification. (B) Demonstration of hACE2 expression at the membrane of cells transfected with both plasmids, high magnification, merge images of GFP, hACE2, and nuclei labels. (C, D) qRT-PCR measurement of N copies in cells. (C) Measurement at 2 days postexposure with virulent SARS-CoV-2, comparison of GFP and GFP+hACE2 overexpression. (D) Decline of RNA levels from day 0 to day 2 postexposure, and comparison of heat-inactivated and virulent virus.

Acknowledgments
This image is the copyrighted work of the attributed author or publisher, and ZFIN has permission only to display this image to its users. Additional permissions should be obtained from the applicable author or publisher of the image. Full text @ Front Cell Infect Microbiol