IMAGE

Figure 4

ID
ZDB-IMAGE-220403-41
Source
Figures for Laghi et al., 2022
Image
Figure Caption

Figure 4

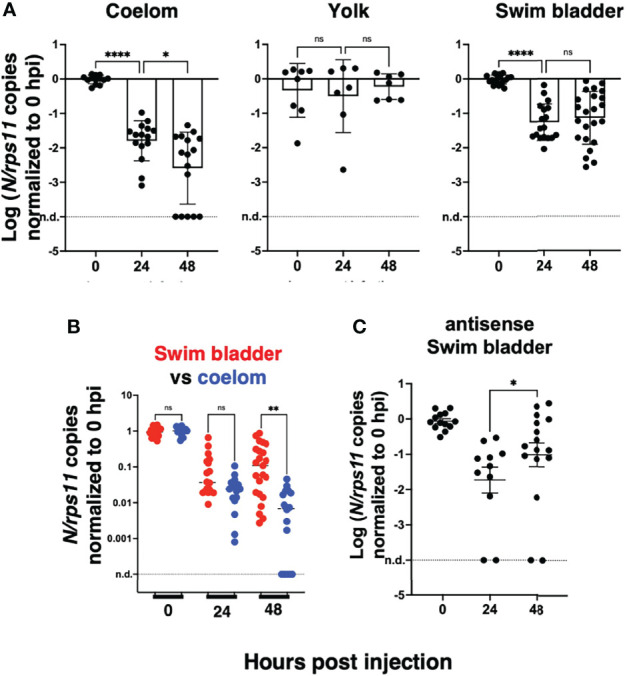
Statistical analysis of viral transcript quantifications, after normalization to the means of values measured at 0 hpi for each experiment. (A) Comparison of SARS-CoV-2 RNA loads over time in each microinjection location; ANOVA analysis of log-transformed values, not assuming equal SDs (Brown–Forsythe test with Dunn’s correction). Results pooled from four, two, and five experiments for coelom, yolk, and swim bladder injections, respectively. (B) Comparison of coelom and swim bladder injections at each time point; non-parametric multiple comparisons of non-transformed values (Kruskal–Wallis test with Dunn’s correction). (C) Comparison of antisense transcripts in the swim bladder, log-transformed values, Mann–Whitney test, pooled from three experiments. ns, not significant; *p < 0.05; **p < 0.01; ****p < 0.0001.

Acknowledgments
This image is the copyrighted work of the attributed author or publisher, and ZFIN has permission only to display this image to its users. Additional permissions should be obtained from the applicable author or publisher of the image. Full text @ Front Cell Infect Microbiol