
- Title
-
Cryo-EM structure of the heptameric calcium homeostasis modulator 1 channel
- Authors
- Ren, Y., Li, Y., Wang, Y., Wen, T., Lu, X., Chang, S., Zhang, X., Shen, Y., Yang, X.
- Source
- Full text @ J. Biol. Chem.

Figure 1. The overall architecture of heptamer+LCH. The surface (A) and cartoon (D) representations of the cryo-EM density map of heptameric drCALHM1 viewed from the extracellular side of the membrane. The seven subunits are represented by different colors. The surface (B) and cartoon (E) representations of the cryo-EM density map of heptamer+LCH viewed parallel to the membrane. The lipid-like density is gray. The surface (C) and cartoon (F) representations of the cryo-EM density map of heptamer+LCH viewed from the cytosolic side of the membrane. LCH, long C-terminal helix. |
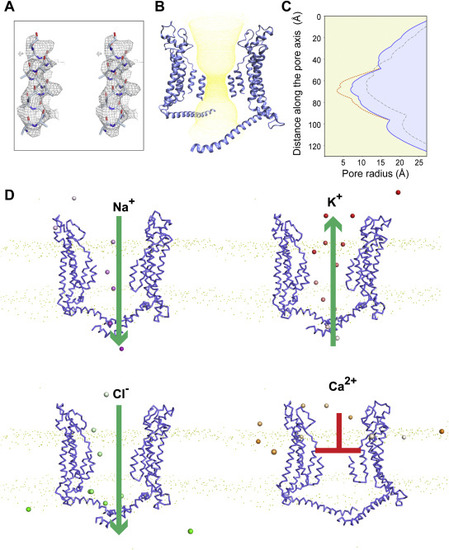
Figure 2. The center pore is in an ATP-nonconductive state. A, the stereo image for the fit of the N-helix (a polyalanine model) in the map. B, yellow dots represent the permeation path of the heptamer, where the N-helix is built as a polyalanine model. C, the pore radius along the central axis of drCALHM1 in different oligomerization states is marked as follows: Orange represents heptamer, where the N helix has a putative side chain; blue represents heptamer, where the N helix is a polyalanine model; gray represents octamer, where the N helix is a polyalanine model. D, the position of the ion in the heptamer channel in the coarse-grained simulations. Two opposing subunits of the heptamer are shown in ribbon. Na+, K+, Cl−, and Ca2+ ions are shown in the sphere model and colored purple, red, green, and orange, respectively. The color changes from transparent to opaque with the simulation time. |
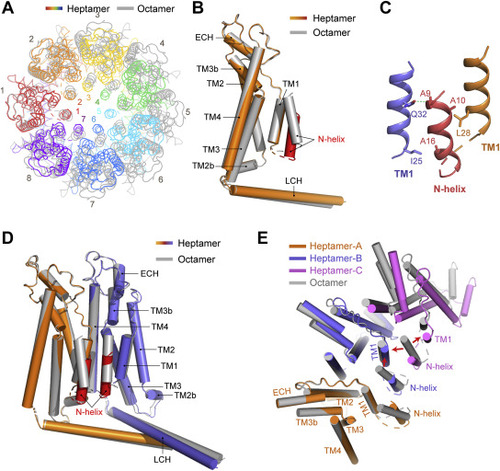
Figure 3. Comparison of the structures of heptamer and octamer. A, cartoon representation of the drCALHM1 heptamer (rainbow) and octamer (gray), viewed from the top of the membrane after superimposing the protomer of each oligomer. B, the superposition of the transmembrane domain of the drCALHM1 heptamer (orange) and octamer (gray), viewed from the side of the membrane. The N-helix of the heptamer is marked in red for better contrast. C, the interaction between the N-helix and TM1. The orange TM1 and the red N-helix are in the same protomer, and the blue TM1 is in another adjacent protomer. The dashed lines represent hydrogen bonds. D, the comparison of the dimers of different oligomerization states by superimposing a protomer. The protomer of the heptamer is superimposed in orange, the other is blue, and the N-helix is marked red for contrast. The octamer is gray. E, comparison with trimers of the drCALHM1 heptamer and octamer (gray) by superimposition of a protomer, viewed from the top of the membrane. The three protomers of the heptamer are represented by orange, blue, and magenta. The red arrows indicate the steric clashes between the N-helix of the octamer and adjacent TM1 subunits. |
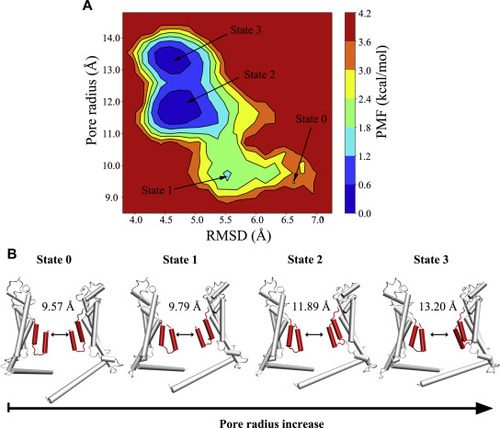
Figure 4. The updown motion of the N-helix increases the pore diameter. A, two-dimensional PMF profile of the RMSD of the P1 N-helix versus the pore radius in the heptameric channel. The initial structure and three low-energy conformational states during supervised MD simulations are labeled state 0, state 1, state 2, and state 3. B, representative structures of P4 and P7 in state 0, state 1, state 2 and state 3 of the heptameric channel. Two opposing protomers of the heptamer are shown in cartoon. PMF, potential of mean force. |

Figure 5. Overall structure of heptamer-noLCH and octamer-noLCH. Density maps (A–C) and cartoons (D–F) of heptamer-noLCH in different directions. Blue and yellow are interlaced between adjacent subunits. Density maps (G–I) and cartoons (J–L) of different sides of octamer-noLCH. The adjacent subunits are interlaced with purple and yellow. To clearly show the changes in subunit assembly during the transition of the oligomeric state, the key subunits are marked with different degrees of green. The lipid-like densities are in orange. |