
Fig. 2
- ID
- ZDB-IMAGE-220701-21
- Publication
- Ren et al., 2022 - Cryo-EM structure of the heptameric calcium homeostasis modulator 1 channel
- All Figures
- Figures for Ren et al., 2022
|
Fig. 2
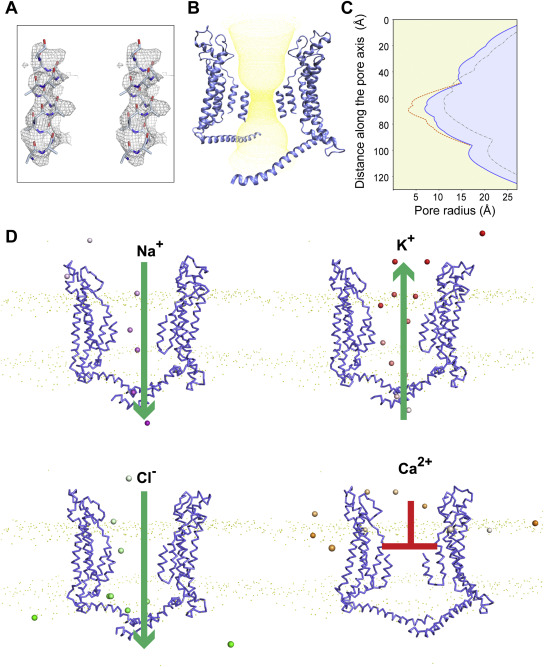
Figure 2. The center pore is in an ATP-nonconductive state. A, the stereo image for the fit of the N-helix (a polyalanine model) in the map. B, yellow dots represent the permeation path of the heptamer, where the N-helix is built as a polyalanine model. C, the pore radius along the central axis of drCALHM1 in different oligomerization states is marked as follows: Orange represents heptamer, where the N helix has a putative side chain; blue represents heptamer, where the N helix is a polyalanine model; gray represents octamer, where the N helix is a polyalanine model. D, the position of the ion in the heptamer channel in the coarse-grained simulations. Two opposing subunits of the heptamer are shown in ribbon. Na+, K+, Cl−, and Ca2+ ions are shown in the sphere model and colored purple, red, green, and orange, respectively. The color changes from transparent to opaque with the simulation time.