
Fig. 3
- ID
- ZDB-IMAGE-220701-22
- Publication
- Ren et al., 2022 - Cryo-EM structure of the heptameric calcium homeostasis modulator 1 channel
- All Figures
- Figures for Ren et al., 2022
|
Fig. 3
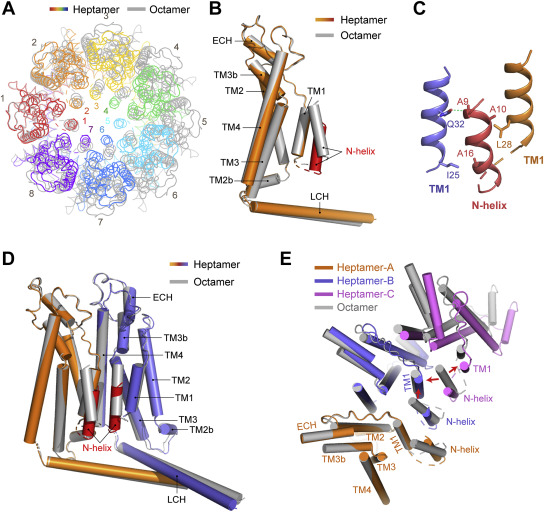
Figure 3. Comparison of the structures of heptamer and octamer. A, cartoon representation of the drCALHM1 heptamer (rainbow) and octamer (gray), viewed from the top of the membrane after superimposing the protomer of each oligomer. B, the superposition of the transmembrane domain of the drCALHM1 heptamer (orange) and octamer (gray), viewed from the side of the membrane. The N-helix of the heptamer is marked in red for better contrast. C, the interaction between the N-helix and TM1. The orange TM1 and the red N-helix are in the same protomer, and the blue TM1 is in another adjacent protomer. The dashed lines represent hydrogen bonds. D, the comparison of the dimers of different oligomerization states by superimposing a protomer. The protomer of the heptamer is superimposed in orange, the other is blue, and the N-helix is marked red for contrast. The octamer is gray. E, comparison with trimers of the drCALHM1 heptamer and octamer (gray) by superimposition of a protomer, viewed from the top of the membrane. The three protomers of the heptamer are represented by orange, blue, and magenta. The red arrows indicate the steric clashes between the N-helix of the octamer and adjacent TM1 subunits.