
- Title
-
Analysis of transcribed sequences from young and mature zebrafish thrombocytes
- Authors
- Fallatah, W., De, R., Burks, D., Azad, R.K., Jagadeeswaran, P.
- Source
- Full text @ PLoS One
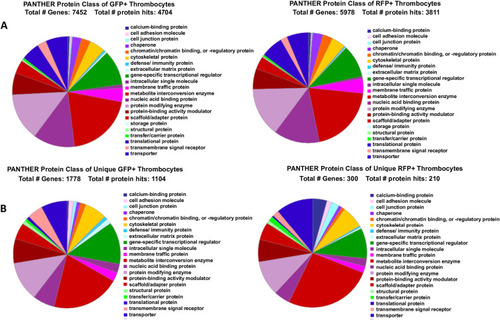
A. When 8,746 genes expressed in GFP+ and 6990 genes expressed in RFP+ thrombocytes thrombocytes were uploaded into the PANTHER program, and |
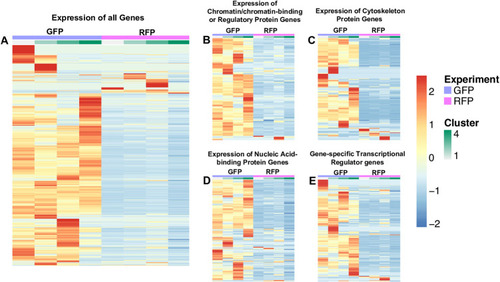
Genes were arbitrarily clustered via k-means clustering ranging from k = 2 to k = 10. The expression of genes is based on the average mean counts of cells falling into the generated clusters. The cellRanger t-SNE graphs were used in choosing the best clustering and 4 clusters were found. A spreadsheet with a sheet for each cluster type was generated. The counts covered a large range (0–120+), and row-wise scaling on the values was performed, which provided a range of -2 to 2. A. Expression of all genes, 8746 genes in GFP+ thrombocytes and 6990 genes in RFP+ thrombocytes. B. Expression of chromatin/chromatin-binding or regulatory protein genes, 120 genes in GFP+ thrombocytes and 106 genes in RFP+ thrombocytes. C. Expression of cytoskeleton protein genes, 217 genes in GFP+ thrombocytes and 158 genes in RFP+ thrombocytes. D. Expression of nucleic acid-binding protein genes, 535 genes in GFP+ thrombocytes, and 478 genes in RFP+ thrombocytes. E. Expression of gene-specific transcriptional regulator genes, 449 genes in GFP+ thrombocytes, and 329 genes in RFP+ thrombocytes. Purple indicates GFP+ thrombocytes, and pink indicates RFP+ thrombocytes followed by clusters from 1 to 4 shown in light green to dark green. For each gene, red is upregulated, and blue is downregulated in the corresponding sample. |
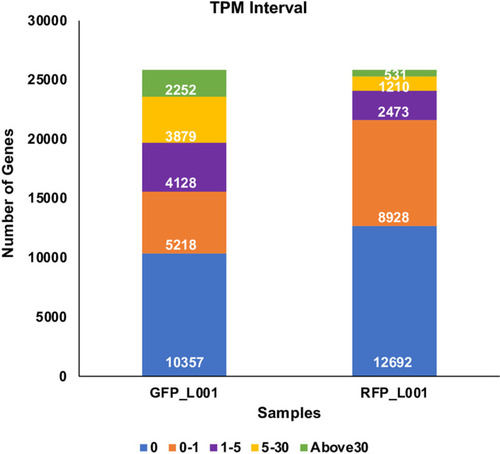
Transcripts from 24 scRNASeq files, 12 for GFP+ and 12 for RFP+ thrombocytes were quantified. Among these files, 4 GFP+, and 4 RFP+ files (in fastq format) that showed a mapping percentage of almost 45–46% to the zebrafish genome were chosen. The 4 GFP fastq files were merged to one fastq file, and similarly 4 RFP fastq files were also merged to one fastq file and used in TPM analysis. Bar graphs show TPM distribution obtained in this analysis and are divided into five intervals for each sample representing the number of genes with TPM values from 0 to >30, and these TPM values are coded by different colors with a key shown below. |
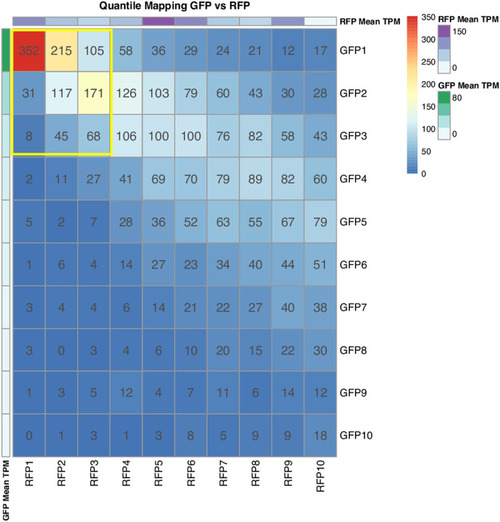
We have divided the expressed genes in each dataset into 10 quantiles. We have compared the genes in each quantile across the pair of datasets. In each quantile, the quantile map shows the number of common genes between the two datasets. The bars on the right of the quantile map indicate the color codes and the number of genes. The data value bars on the rightmost indicate mean TPM values; green color, the highest TPM values for GFP+ thrombocytes, and purple color, the highest TPM values for RFP+ thrombocytes. |
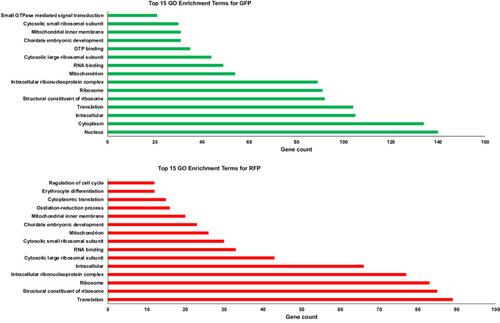
The highly expressed gene lists for GFP+ and RFP+ thrombocytes were analyzed separately using DAVID to identify gene ontology (GO) categories. The top 15 GO enrichment analysis of A. GFP+ thrombocytes and B. RFP+ thrombocytes by DAVID functional analysis. Bars represent the number (x-axis) of highly expressed genes in pathways (y-axis) for each dataset. |
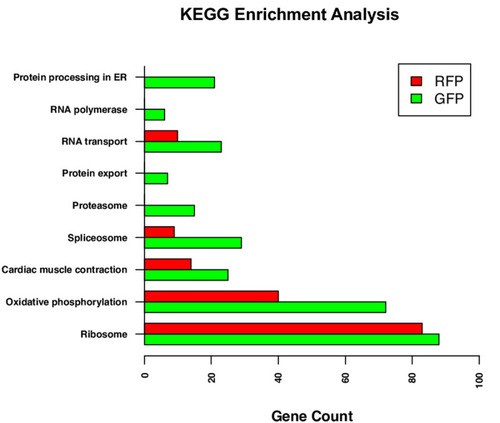
The highly expressed gene lists for GFP+ and RFP+ thrombocytes were analyzed separately using the DAVID to identify enriched KEGG pathways. Bars represent the number of highly expressed genes in pathways for GFP+ and RFP+ thrombocyte datasets. |
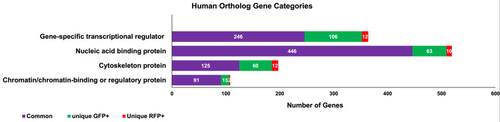
Fig 7. Different categories of human ortholog gene transcripts found in GFP+ and RFP+ thrombocytes. The raw data was used to obtain the list of zebrafish genes expressed in GFP+ thrombocytes and RFP+ thrombocytes using Ensembl and ZFIN databases. The list of human orthologs corresponding to zebrafish genes was also obtained using Ensembl and ZFIN databases. The list of these human orthologs were uploaded into the PANTHER program to obtain protein categories as well as to find human orthologs corresponding to unique and commonly expressed genes in GFP+ and RFP+ thrombocytes. The bar graph represents the corresponding human orthologs of the unique RFP+ genes, unique GFP+ genes, and both RFP+ and GFP+ common genes shown in red, green, and purple colors, respectively. The number of human ortholog genes is shown in each bar, including their functional protein categories. The protein categories are gene-specific transcriptional regulators, nucleic acid-binding proteins, cytoskeleton proteins, and chromatin/chromatin-binding or regulatory proteins. |
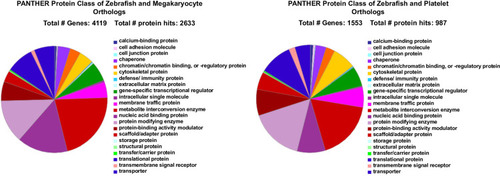
A. The 9143 total thrombocyte gene transcripts and 7708 human megakaryocyte gene transcripts were combined in a spreadsheet and color-coded. Then duplicate genes were selected first and the duplicates were eliminated to give a list of 4224 human orthologs which were uploaded into the PANTHER program, and |