
Image
|
Figure Caption
Fig 5
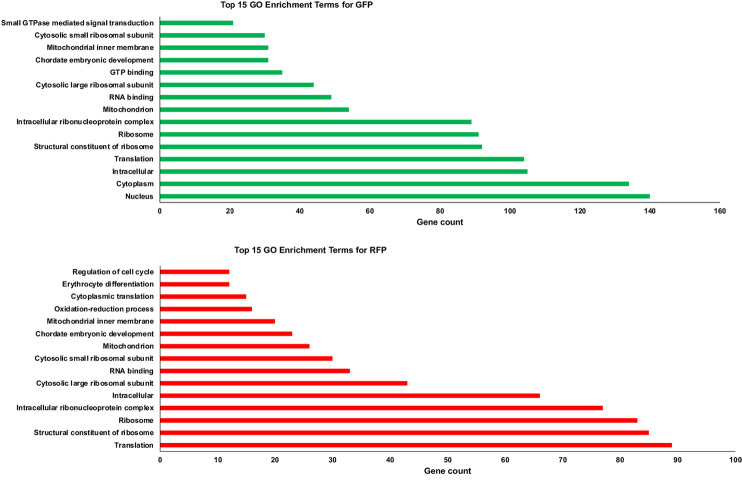
The highly expressed gene lists for GFP+ and RFP+ thrombocytes were analyzed separately using DAVID to identify gene ontology (GO) categories. The top 15 GO enrichment analysis of A. GFP+ thrombocytes and B. RFP+ thrombocytes by DAVID functional analysis. Bars represent the number (x-axis) of highly expressed genes in pathways (y-axis) for each dataset.
Acknowledgments
This image is the copyrighted work of the attributed author or publisher, and
ZFIN has permission only to display this image to its users.
Additional permissions should be obtained from the applicable author or publisher of the image.
Full text @ PLoS One