
|
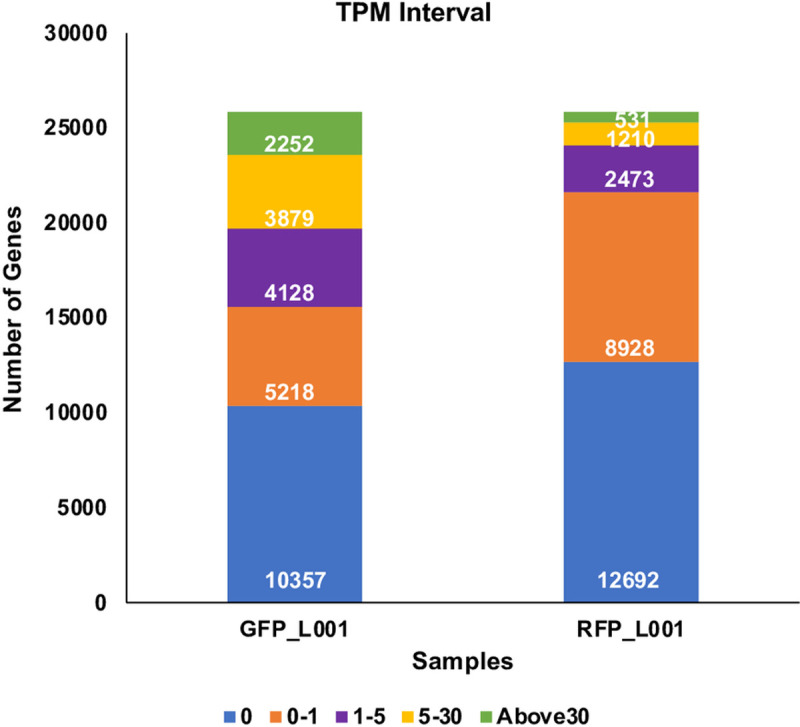
Fig 3
Transcripts from 24 scRNASeq files, 12 for GFP+ and 12 for RFP+ thrombocytes were quantified. Among these files, 4 GFP+, and 4 RFP+ files (in fastq format) that showed a mapping percentage of almost 45–46% to the zebrafish genome were chosen. The 4 GFP fastq files were merged to one fastq file, and similarly 4 RFP fastq files were also merged to one fastq file and used in TPM analysis. Bar graphs show TPM distribution obtained in this analysis and are divided into five intervals for each sample representing the number of genes with TPM values from 0 to >30, and these TPM values are coded by different colors with a key shown below.