
|
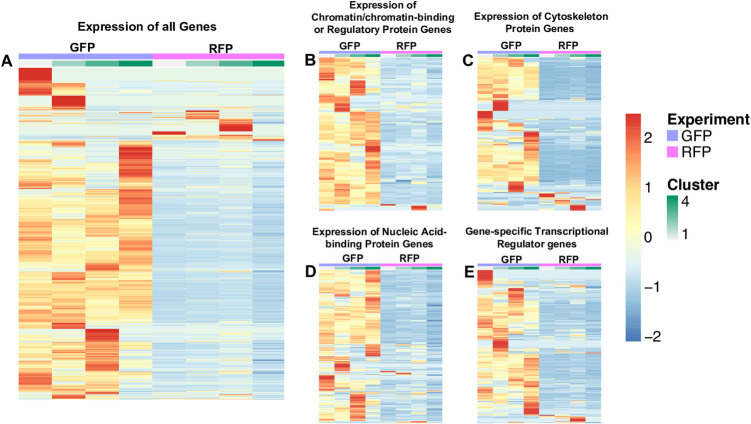
Fig 2
Genes were arbitrarily clustered via k-means clustering ranging from k = 2 to k = 10. The expression of genes is based on the average mean counts of cells falling into the generated clusters. The cellRanger t-SNE graphs were used in choosing the best clustering and 4 clusters were found. A spreadsheet with a sheet for each cluster type was generated. The counts covered a large range (0–120+), and row-wise scaling on the values was performed, which provided a range of -2 to 2. A. Expression of all genes, 8746 genes in GFP+ thrombocytes and 6990 genes in RFP+ thrombocytes. B. Expression of chromatin/chromatin-binding or regulatory protein genes, 120 genes in GFP+ thrombocytes and 106 genes in RFP+ thrombocytes. C. Expression of cytoskeleton protein genes, 217 genes in GFP+ thrombocytes and 158 genes in RFP+ thrombocytes. D. Expression of nucleic acid-binding protein genes, 535 genes in GFP+ thrombocytes, and 478 genes in RFP+ thrombocytes. E. Expression of gene-specific transcriptional regulator genes, 449 genes in GFP+ thrombocytes, and 329 genes in RFP+ thrombocytes. Purple indicates GFP+ thrombocytes, and pink indicates RFP+ thrombocytes followed by clusters from 1 to 4 shown in light green to dark green. For each gene, red is upregulated, and blue is downregulated in the corresponding sample.