Corral-Juan, M., Casquero, P., Giraldo-Restrepo, N., Laurie, S., Martinez-Piñeiro, A., Mateo-Montero, R.C., Ispierto, L., Vilas, D., Tolosa, E., Volpini, V., Alvarez-Ramo, R., Sánchez, I., Matilla-Dueñas, A.
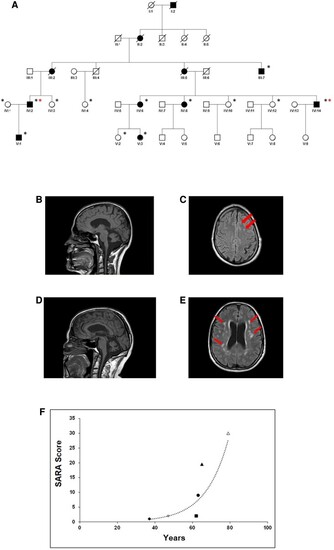
Pedigree, MRI and SARA scale from M-SCA patients. (A) Pedigree of the five-generation family from the Balearic island of Menorca with 11 affected individuals. Black asterisks denote individuals included in genome-wide linkage studies; red asterisks denote individuals studied by WES. (B–E) Sagittal and transverse T1-weighted MRI scans of Patient V:1 brain revealing cerebellar atrophy (B), and initial signs of focal brain demyelination lesions noted by red arrows (C). Imaging of the brain of the father of patient V:1 (IV:2) also showed severe cerebellar vermis atrophy (D), and marked cerebral demyelination noted by red arrows (E) compared with age- and gender-matched controls (Supplementary Fig. 3). (F) SARA clinical scale of six affected patients showing variable severity and progression of the disease following an exponential pattern (rs(4) = 0.92, P = 0.008).
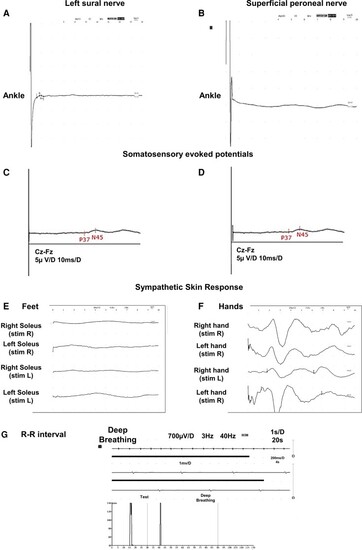
Moderate axonal sensory polyneuropathy predominantly in the lower limbs and abnormal SSR and R–R interval in affected patients III:7, IV:6 and IV:2, respectively. (A and B) Moderate axonal sensory polyneuropathy predominantly in the lower limbs in IV:2. At later stages of disease progression, patients revealed reduction of sensory nerve amplitudes also in upper limbs (Supplementary Fig. 4). Tibial nerve SSEPs showed an abnormal latency of P37 response in IV:2 (C) and III:7 (D). (E) Abnormal SSR in lower limbs displayed abnormality in two patients (IV:2 and IV:6). (G) Altered R–R interval in Patient IV:2.
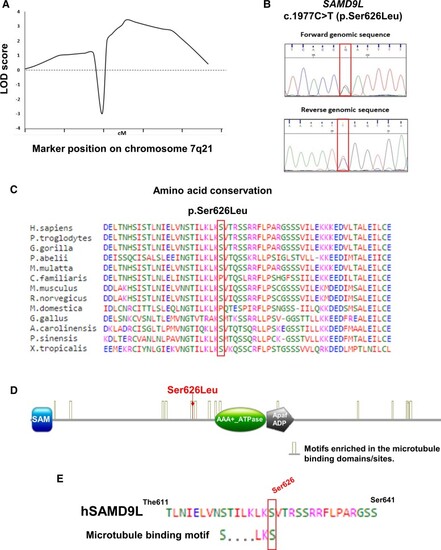
Genome-wide linkage analysis in combination with whole-exome NGS sequencing identifies the c.1877C > T (p.Ser626Leu) mutation within the SAMD9L gene on 7q21 as the causative mutation. (A) LOD score plots for chromosomal region 7q21. (B) The c.1877C > T (p.Ser626Leu) SAMD9L variant is predicted as deleterious by six in silico algorithms. (C) The mutated amino acid was found highly conserved. (D) HHpred protein sequence profile predictor identified protein motifs significantly similar to SAM, AAA+ ATP-ase/Hydrolase and Apaf-1 ADP bound domains. SAMD9L contains motifs enriched in microtubule-binding proteins. (E) The p.Ser626Leu localizes within the microtubule predicted motif S….LKS in human SAMD9L.
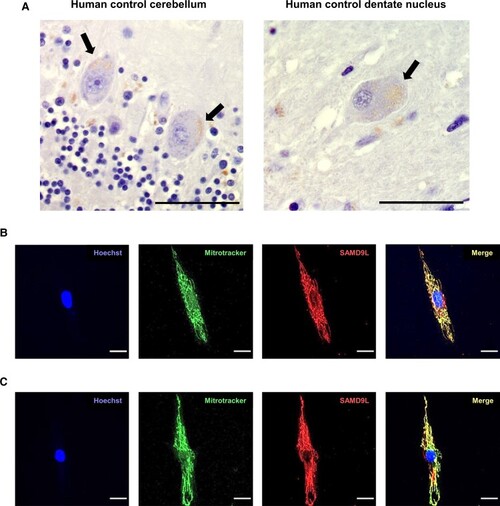
Mitochondrial localization of SAMD9L in human cerebellar Purkinje cells and multipolar neurons of the dentate nucleus and fibroblasts. (A) Immunostaining with anti-SAMD9L antibody in human control cerebellar sections revealed a punctate staining mainly in Purkinje cell soma (left) and in multipolar neurons (right) of the human dentate nucleus indicative of mitochondrial staining. Black arrows point to SAMD9L staining in Purkinje and multipolar neurons. (B and C) Immunofluorescence staining of fibroblasts from human control (B) and a M-SCA affected patient (C) showed co-localization of SAMD9L to mitoTracker Red CMXRos demonstrating mitochondrial co-localization. Magnification bars: 50 µm (A), 20 µm (B and C).
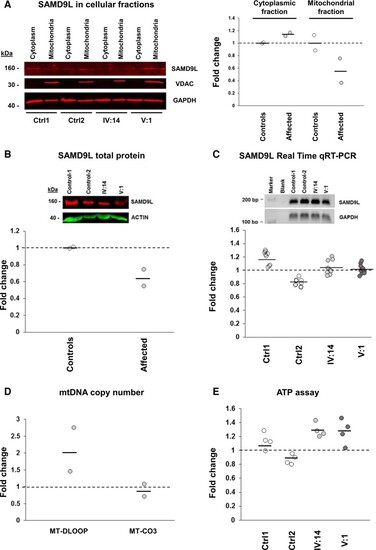
Reduced SAMD9L protein levels and mitochondrial alterations in M-SCA patients’ fibroblasts. (A) Immunoblotting of lysed and subcellular fractioned fibroblasts confirmed SAMD9L mitochondrial localization, and decreased SAMD9L protein levels in the mitochondrial (A) and total (B) cellular extracts from patients’ fibroblasts samples (N = 2) without alteration of SAMD9L cDNA levels compared by qRT-PCR (C) [N = 2 fibroblasts samples for each group of individuals (patients and controls); three technical replicates each for SAMD9L and three technical replicates each for GAPDH housekeeping gene expression]. (D) Increased copy number of the mtDNA D-LOOP mitochondrial genome region in patient’s fibroblasts samples is suggestive of an increased activity of mtDNA replication. (E) A trend of increased ATP was found in mitochondrial fractions of affected fibroblasts [N = 2 fibroblasts samples for each group of individuals (patients and controls); four technical replicates each] compared with age-matched controls [N = 2 fibroblasts samples for each group of individuals (patients and controls); four technical replicates each]. Each point represents relative ATP levels compared with controls after normalizing for protein concentration. Controls values were set to 1 (dotted line).
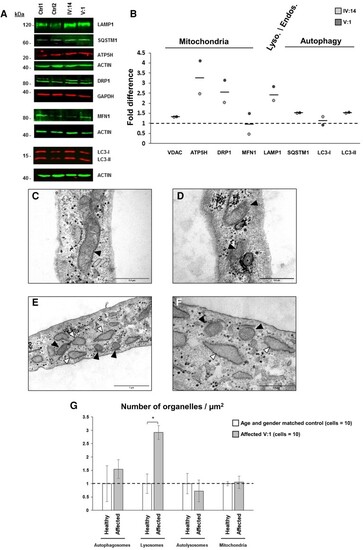
Mitochondrial and lysosome/autophagy alterations in fibroblasts from ataxia patients. (A and B) The ATP5H and DRP1 mitochondrial associated proteins levels were found increased without changes in VDAC and MFN1 suggestive of mitochondrial biogenesis. Furthermore, lysosomal LAMP1 together with SQSTM1 and LC3-II protein levels were found increased suggestive of mitophagy. LAMP1, MFN1, SQSTM1, ATP5H AND LC3 proteins levels were normalized to actin B (ACTIN) and DRP1 proteins levels to GAPDH (Supplementary Figs 22–27). Controls values were set to 1 (dotted line). TEM showed diffused crests in the mitochondrial matrix (C) together with some mitophagy (D) and dilated endoplasmic reticulum (E and F) compared with age-matched control (Supplementary Fig. 13). (G) One-way ANOVA confirmed significantly increased number of lysosomes on patients’ fibroblasts samples (N = 10) compared with controls [N = 10; F(1,18) = 6.135, P = 0.023] (Supplementary Fig. 13). Black arrowheads point to mitochondria; white arrowheads point to the dilated endoplasmic reticulum. Asterisks indicate autophagosomes. Magnification bars: 0.5 µm (C, D and F), 1 µm (E). Asterisk denotes significance at P < 0.05. Vertical bars denote SEM.
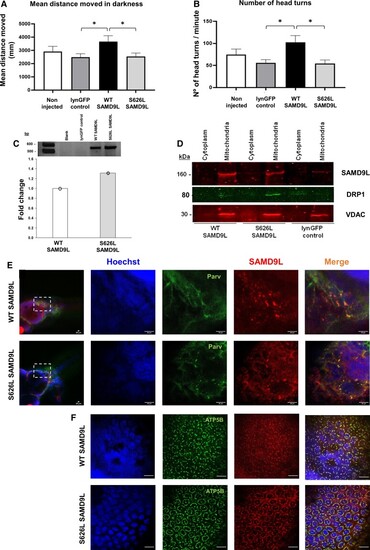
Mutant Ser626Leu SAMD9L triggers locomotive and neurosensory impairment and co-localizes with ATP5B or parvalbumin in zebrafish neurons. (A) One-way ANOVA with the mean distance travelled (mm) during five dark periods of high activity revealed significantly increase in the WT-SAMD9L zebrafish (N = 26) compared with the lynGFP control group (N = 28) [F(1,52) = 6.583, P = 0.013], and significantly decreased in S626L-SAMD9L zebrafish (N = 24) compared with the WT-SAMD9L group [F(1,48) = 4.745, P = 0.034]. (B) The number of head turns during five light–dark cycles of high activity was significantly increased in WT-SAMD9L compared with the control group (Mann–Whitney U = 216, P = 0.010), and significantly decreased in S626L–SAMD9L zebrafish larvae compared with the WT-SAMD9L (Mann–Whitney U = 192.5, P = 0.022), indicative of vestibular and sensory impairment in mutant animals. (C) SAMD9L cDNA expression did not show differences between SAMD9L-WT and SAMD9L-S626L groups compared by qRT-PCR, meaning a pool of five embryos for each group; three technical replicates (three values/group) each for SAMD9L normalized to zebrafish tbp housekeeping gene expression. The average of the three technical replicates was considered as single data point for the statistical analysis (Supplementary Fig. 28). (D) Immunoblotting of lysed cellular fractions corroborated overexpression of either wild-type or mutant SAMD9L and the mitochondrial localization in zebrafish. DRP1 protein levels were found increased in mutants SAMD9L (N = 5) compared with either wild-type (N = 5) or control (N = 5) (Supplementary Figs 29–31). Whole-mount zebrafish immunofluorescence of WT-SAMD9L and S626L-SAMD9L showed mitochondrial staining in the zebrafish spinal cord and peripheral nerves (Supplementary Fig. 16) and in the hindbrain (E), co-localizing with the ATP5B mitochondrial marker (F) and parvalbumin (E) in WT-SAMD9L and S626L-SAMD9L zebrafish larvae neurons. Magnification bars: 20 µm. Asterisk denotes significance at P < 0.05. Vertical bars denote SEM.
Acknowledgments
This image is the copyrighted work of the attributed author or publisher, and
ZFIN has permission only to display this image to its users.
Additional permissions should be obtained from the applicable author or publisher of the image.
Full text @ Brain Commun
Your Input Welcome
Thank you for submitting comments. Your input has been emailed to ZFIN curators who may contact you if
additional information is required.
Oops. Something went wrong. Please try again later.