
- Title
-
Structure-based prediction of HDAC6 substrates validated by enzymatic assay reveals determinants of promiscuity and detects new potential substrates
- Authors
- Varga, J.K., Diffley, K., Welker Leng, K.R., Fierke, C.A., Schueler-Furman, O.
- Source
- Full text @ Sci. Rep.
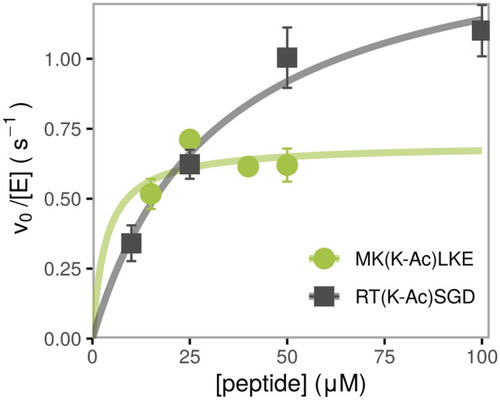
Dependence of deacetylation rate on substrate concentration for two representative peptides catalyzed by HDAC6, measured using the acetate assay. The initial velocity for each substrate concentration was determined from a linear regression of a time course consisting of a minimum of three timepoints, standard error is shown. The kinetic parameters are determined from a nonlinear least square fit of the Michaelis–Menten equation to the data and are listed in Table |
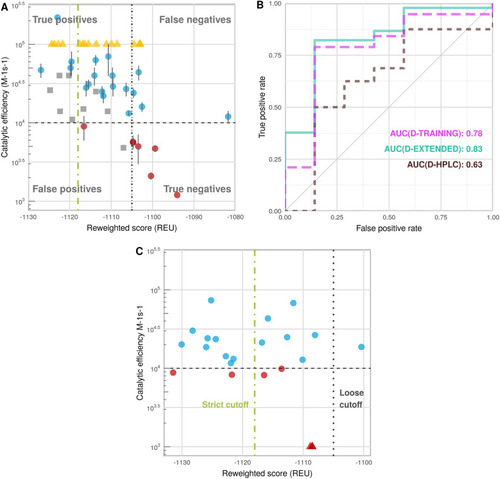
Performance of the calibrated protocol on different datasets (see Supplementary Table |
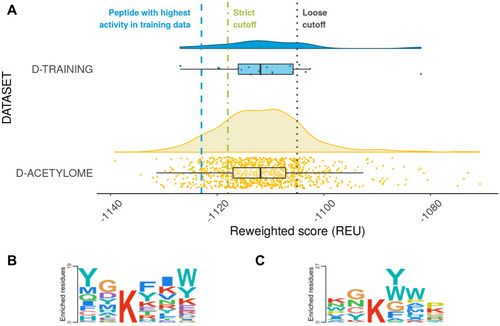
Application of the calibrated protocol to the acetylome to detect novel potential HDAC6 substrates. ( |
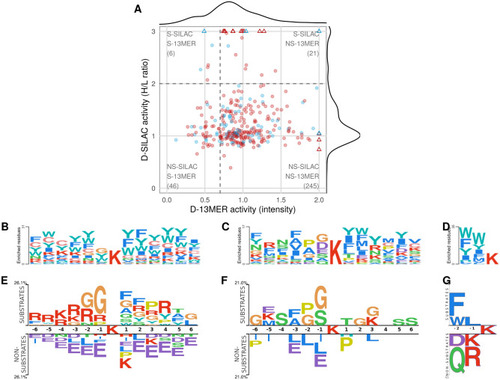
Different datasets of experimentally determined HDAC6 substrates show minor overlap and agreement. Comparison of substrate specificities of different experimental datasets, based on their sequence logos and correlation of substrate activities. ( |
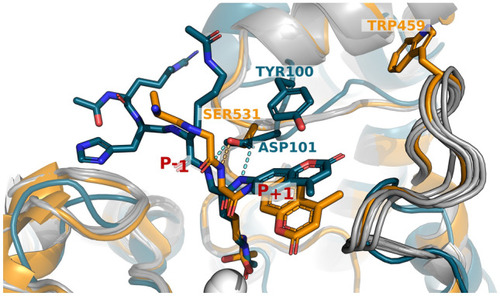
Key differences between HDAC6 and HDAC8 in the coordination of the substrate. The active sites of HDAC6 (receptor from PDB ID 6WSJ, substrate from 5EFN for visualization purposes, orange) and HDAC8 (PDB ID 2V5W, teal) are overlaid. The loops that distinguish the two HDACs are highlighted (orange and teal), together with conformations generated for modeling substrate activity (grey). Residues S531 (HDAC6) and D101 (HDAC8) that coordinate hydrogen bonding (light blue: HDAC6, yellow: HDAC8) to the backbone of the acetylated substrate lysine residue, are also highlighted, as well as positions W459 (HDAC6) and Y100 (HDAC8). The hydroxamic acid inhibitors are shown in sticks, and the catalytic Zn2+ ions are shown as a white sphere. See Text for more details. |