IMAGE

Figure 4

ID
ZDB-IMAGE-220310-5
Source
Figures for Varga et al., 2022
Image
Figure Caption

Figure 4

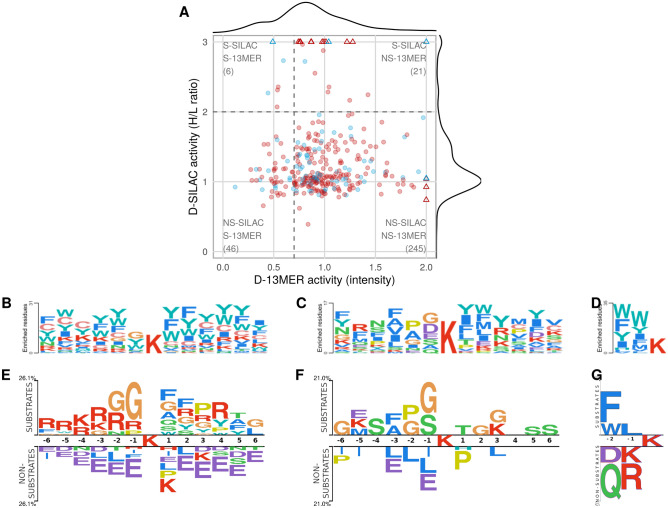
Different datasets of experimentally determined HDAC6 substrates show minor overlap and agreement. Comparison of substrate specificities of different experimental datasets, based on their sequence logos and correlation of substrate activities. (A) Plot of substrate activities for peptides shared between the D-13MER3 and D-SILAC14 datasets. (blue, red: predicted substrates and non-substrates by our protocol; triangles indicate peptides with H/L ratio > 3 in the SILAC experiment, or measured intensity > 2 in the peptide array, for which the values have been capped to fit into the plot; dashed lines indicate cutoffs for defining substrates and non-substrates; S, NS: substrates and non-substrates, respectively) (BF) Sequence logos made with PSSMSearch89 using its default background containing human sequences (BD), and with Two Sample Logo90 using the non-substrate peptides as background for each dataset (EG). (B, E) D-13MER, (C, F) D-SILAC, and (D, G) D-3MER datasets.

Acknowledgments
This image is the copyrighted work of the attributed author or publisher, and ZFIN has permission only to display this image to its users. Additional permissions should be obtained from the applicable author or publisher of the image. Full text @ Sci. Rep.