
Figure 1
- ID
- ZDB-FIG-220310-1
- Publication
- Varga et al., 2022 - Structure-based prediction of HDAC6 substrates validated by enzymatic assay reveals determinants of promiscuity and detects new potential substrates
- Other Figures
- All Figure Page
- Back to All Figure Page
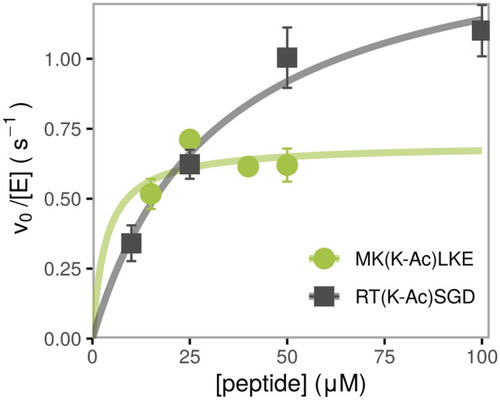
Dependence of deacetylation rate on substrate concentration for two representative peptides catalyzed by HDAC6, measured using the acetate assay. The initial velocity for each substrate concentration was determined from a linear regression of a time course consisting of a minimum of three timepoints, standard error is shown. The kinetic parameters are determined from a nonlinear least square fit of the Michaelis–Menten equation to the data and are listed in Table |