FIGURE

Figure 2

ID
ZDB-FIG-220310-2
Publication
Varga et al., 2022 - Structure-based prediction of HDAC6 substrates validated by enzymatic assay reveals determinants of promiscuity and detects new potential substrates
Other Figures
All Figure Page
Back to All Figure Page
Figure 2

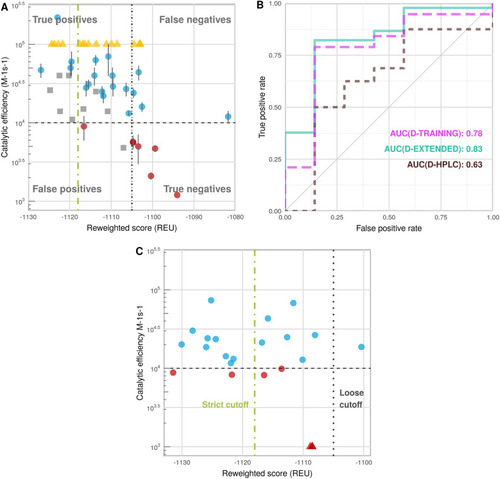
Performance of the calibrated protocol on different datasets (see Supplementary Table S2). (A) Correlation: Predicted vs. measured activities on D-TRAINING (dots, blue: substrates, red: non-substrates); D-CAPPED (yellow triangles); and D-TEST (grey squares) datasets. (B) Binary distinction: ROC curves on D-TRAINING (magenta), D-EXTENDED (cyan) and D-HPLC (brown). (C) Performance of protocol on D-HPLC, a dataset measured using HPLC (from Kutil et al.3). In (A) and (C), a dashed horizontal line denotes the cutoff dividing measured substrates and non-substrates (kcat/KM=104 M−1 s−1). Note the different scales in (A) and (C). The cutoffs dividing predicted substrates from not substrates are indicated as dotted vertical line for the loose cutoff (reweighted score: − 1105) and a dotted-dashed vertical line for the strict cutoff (reweighted score: − 1118).

Expression Data

Expression Detail
Antibody Labeling
Phenotype Data

Phenotype Detail
Acknowledgments
This image is the copyrighted work of the attributed author or publisher, and ZFIN has permission only to display this image to its users. Additional permissions should be obtained from the applicable author or publisher of the image. Full text @ Sci. Rep.