
- Title
-
Reduced α-galactosidase A activity in zebrafish (Danio rerio) mirrors distinct features of Fabry nephropathy phenotype
- Authors
- Elsaid, H.O.A., Furriol, J., Blomqvist, M., Diswall, M., Leh, S., Gharbi, N., Anonsen, J.H., Babickova, J., Tøndel, C., Svarstad, E., Marti, H.P., Krause, M.
- Source
- Full text @ Mol Genet Metab Rep
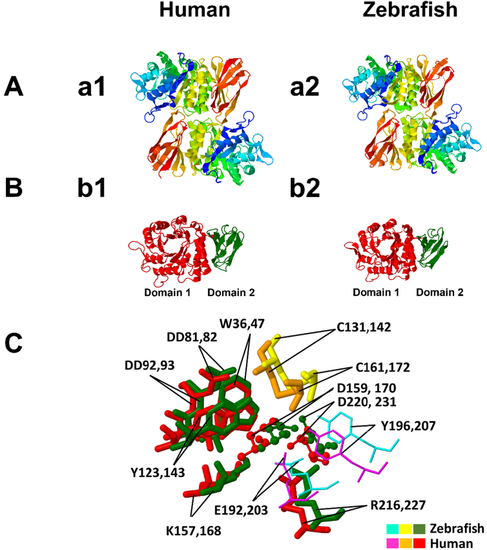
Structure prediction of the zebrafish α-GAL. (a1) homodimer structure of human α-GAL; (a2) homodimer structure of zebrafish α-GAL. The dimers are colored from N-terminal (blue) to C-terminal (red). The structure prediction shows that the zebrafish α-GAL folds in a pattern highly similar to its human counterpart. (b1) is the monomer of a human α-GAL enzyme showing the two domains, while (b2) is the zebrafish α-GAL enzyme showing the same structure. Domain 1, (β/α)8 barrel, extends through residues 32–330 in human (red) and 21–319 in zebrafish (red), and contains the active site, while domain 2 extends through residues 331–429 in human (green) and 320–409 in zebrafish (green) and contains antiparallel β strands. C: the superimposed structure of the two enzymes active sites and substrate binding site, with substrate specificity residues W36, D81, D82, Y123, K157, R216 in zebrafish and W47, D92, D93, Y143, K168, R227 in human, are fully conserved between the two species. The active sites D159 and D220 in zebrafish, D170, and D231 in humans are also conserved. The residues C131 and C161 zebrafish and C142 and C172 human help to stabilize the conformation of the substrate-binding site through the formation of disulfide bonds. The substrate-binding site boundaries E192 and Y196 in zebrafish correspond to E203 and Y207 in humans. Color ligands for zebrafish and human are shown in plate C. (For interpretation of the references to color in this figure legend, the reader is referred to the web version of this article.) |
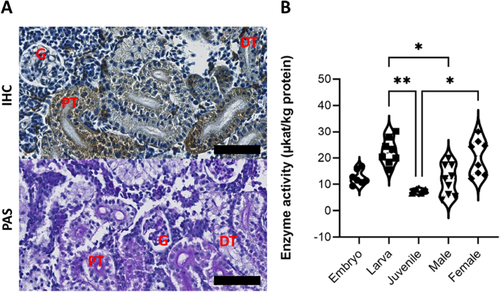
Kidney tissue distribution and enzyme activity in wild type zebrafish. (A) Immunohistochemistry (IHC) staining for Zebrafish α-GAL in wild-type adult zebrafish kidney. The expression pattern is similar in both genders. The protein was abundantly detectable in the cytoplasm of renal tubule cells, and to a lower extent in the glomerulus. Hematoxylin was used as counterstain. The lower panel shows the three renal structures, as stained with Periodic Acid Schiff (PAS). Scale bar (in black) = 50um. (B) Wild-type zebrafish α-GAL activity as evaluated in the whole embryo, larvae, and juvenile whole body tissue lysates and in adult male and female kidney tissue lysates (Kruskal-Wallis, P ≤ 0.05). Results of the Dunn EXPRESSION / LABELING:
|
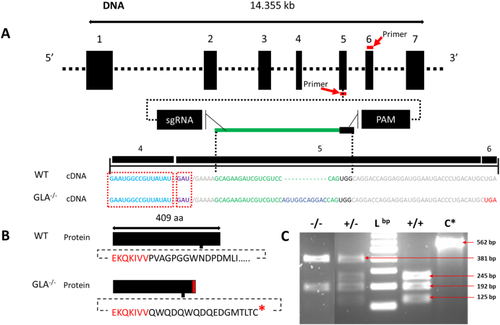
Generation and verification of a GLA mutant line. (A) CRISPR/Cas9-based gene-editing tool used to generate mutant zebrafish. The targeted genomic sequence for the introduction of the insertion mutation in the exon 5 is illustrated. The eleven base pair insertion (shown in blue) is highlighted in the cDNA sequence. The putative stop codon after the insertion is highlighted in red. Guide RNA and PAM sequences are highlighted in green and black, respectively. Mutation occurred 45 bp from the proton donor catalytic site (in violet) and 120 bp from the substrate binding site (in light blue) that is in exon 4. Primers for genotyping and sequencing spanning exons 5 and 6 are indicated by the red bar (B) The insertion mutation leads to a frameshift with a premature stop codon (in red) 16 amino acid downstream the insertion region (the lower panel). (C) PCR screen shows that the insertion interrupts one of the two restriction enzyme digestion sites resulting in two PCR fragments in the mutant (−/−) instead of three in the wild type (+/+), Lbp = DNA ladder in base pairs (bp), C* = wild type undigested PCR product (the agarose gel image is edited for illustration, full image can be reviewed in sup.5). (For interpretation of the references to color in this figure legend, the reader is referred to the web version of this article.) |

Histological distribution and enzymatic activity of Zebrafish- α-GAL protein in the GLA mutant zebrafish. (A) Scanned digital images show α-GAL antibody and periodic acid Schiff staining. Note that PAS staining shows dilated capillary loops and thinner Bowman's space (yellow arrowheads) in mutant compared to wild type animals. (B) Quantification of immunohistochemical analysis of sections from wild-type and mutant kidneys. Signal intensity is significantly higher in wild type compared to mutant tissues (Mann-Whitney |
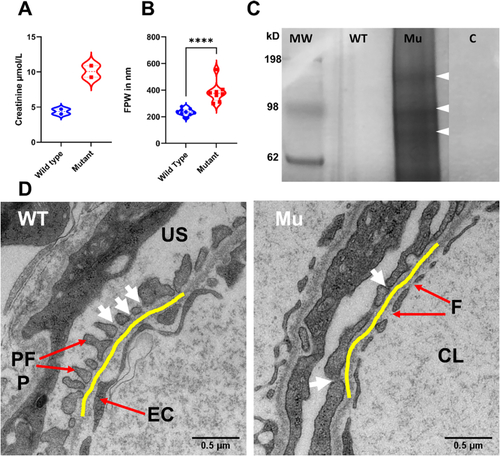
GLA-mutant zebrafish show compromised filtration barrier function. (A) Renal impairment is documented by double plasma creatinine level in the mutant zebrafish. (B and D) FPW quantitation in adult zebrafish kidney on TEM images reveals wider foot processes (podocyte foot process effacement) in the mutant (Mann-Whitney Test, P < 0.05. Violin plots depict results within the 95th percentile. The yellow line highlights the GBM. White arrows point to the silt diaphragm between two adjacent foot processes. CL = capillary lumen, F = fenestrae, EC = endothelial cell, US = urinary space, PFP = podocyte foot process. (C) Renal function impairment is further validated by the leakage of high molecular weight proteins observed by SDS-PAGE electrophoresis. The illustrated protein bands in the fig. (80 kDa, 98 kDa and 150 kDa wight arrowheads) were identified by mass spectrometry analysis. MW = marker in kDa, WT = wild type, Mu = Mutant, C = control (water). The polyacrylamide gel image is edited for illustration, full gel image can be reviewed in Sup.7. PHENOTYPE:
|