
- Title
-
Single-Cell RNA Sequencing Characterizes the Molecular Heterogeneity of the Larval Zebrafish Optic Tectum
- Authors
- Martin, A., Babbitt, A., Pickens, A.G., Pickett, B.E., Hill, J.T., Suli, A.
- Source
- Full text @ Front. Mol. Neurosci.
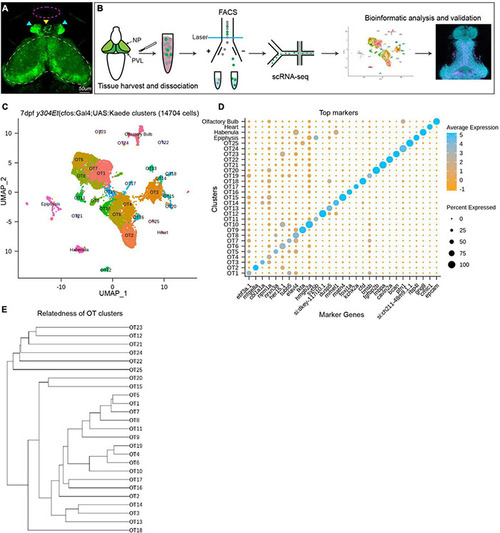
Analysis of scRNA-seq data reveals 25 distinct populations within the larval zebrafish optic tectum. (A) 7 dpf representative image of the y304Et(cfos:Gal4;UAS:Kaede) enhancer trap line used to obtain tectal cells. Optic tectum (white dashes), habenula (cyan arrows), epiphysis (yellow arrow), and olfactory system (magenta dashes) are indicated. The heart is not shown. (B) Experimental workflow for the collection and isolation of tectal cells. Heads from 7 dpf Kaede+ larvae were collected and enzymatically dissociated, followed by FACS to isolate fluorescent cells. After quality control, 14,704 single-cell libraries obtained by the 10X Genomics Chromium platform were used for downstream analysis. PCA and graph-based clustering were utilized to sort cells into clusters and identify candidate marker genes. Bioinformatic validation and spatial mapping was completed via fluorescent HCR RNA-FISH. (C) Uniform manifold approximation and projection (UMAP) showing cell populations identified via scRNA-seq analysis of 14,704 Kaede+ cells. Each point represents a single cell colored according to cluster identity as determined by unbiased graph-based clustering using the Louvain algorithm with multilevel refinement. UMAP embedding was used for visualization purposes only and not to define the clusters. The resulting two-dimensional spatial arrangement of clusters is a product of genetic similarity, as similar clusters are represented as closer together. (D) Candidate marker genes (columns) for each cluster (rows) were nominated by differential expression analysis wherein candidate genes must: (1) be expressed in at least 50% of cells within that cluster, and (2) show specificity to the cluster compared to all other cells by exhibiting ≥ 1 log2 fold-change in expression with at least 25% difference in gene presence. (E) Phylogram showing cluster relatedness based upon variable features defined by SCTransform and calculated within PCA space. |
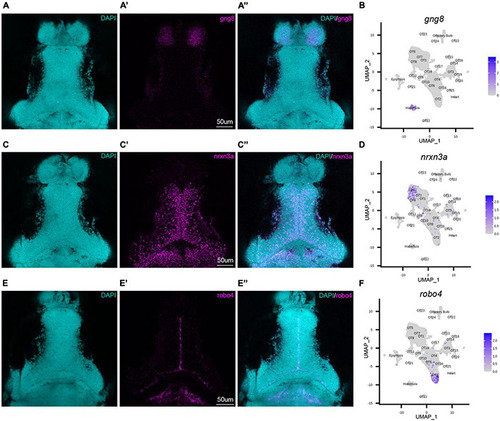
HCR RNA-FISH validates bioinformatic findings and spatially locates tectal populations. Hybridization chain reaction RNA-fluorescence in situ hybridization (HCR RNA-FISH) was performed using proprietary custom probe sets designed by Molecular Instruments to spatially map populations and validate bioinformatic exclusion of non-interest cells. (A–A”,C–C”,E–E”) Single z-slices of representative images showing expression of habenula (gng8) and OT (nrxn3a, robo4) markers in 7 dpf larval zebrafish. (A–A”) gng8+ cells are located in the habenula, validating gng8 expression as a method for annotating habenular cells and spatially mapping 89% of habenula cells (Supplementary Table 2). (B) Feature plot showing gng8 expression is restricted to the annotated habenula cluster. (C–C”) nrxn3a+ cells are primarily located medially within the periventricular layer, and spatially map 54% of OT5 (Supplementary Table 2). (D) Feature plot showing expression of nrxn3a is enriched in OT5 and to a lesser extent, OT8. (E–E”) robo4+ OT cells are located near the intratectal commissure, likely within the tectal proliferation zone, and spatially map 51% of OT2 cells (Supplementary Table 2). (F) Feature plot showing robo4 expression is restricted to OT2. All HCR RNA-FISH panels include DAPI staining as a cellular reference. EXPRESSION / LABELING:
|
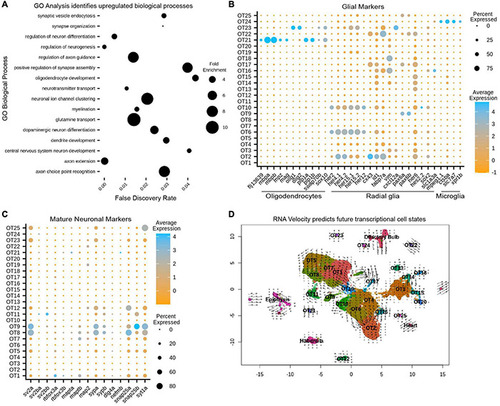
Gene ontology (GO) and RNA velocity analysis reveals upregulated biological processes and predict future transcriptional cell states. |

Gene expression profiles characterize the neuronal profiles of OT cells. |
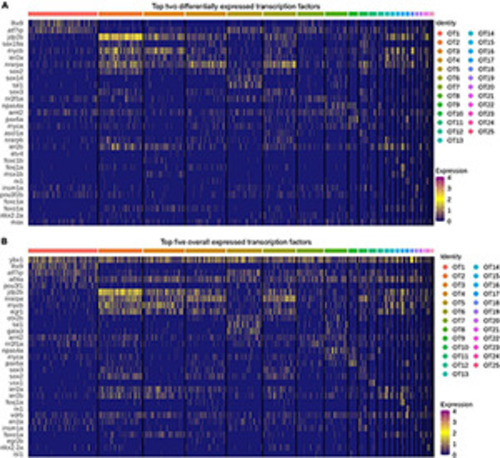
Top transcription factors in the larval zebrafish OT. |
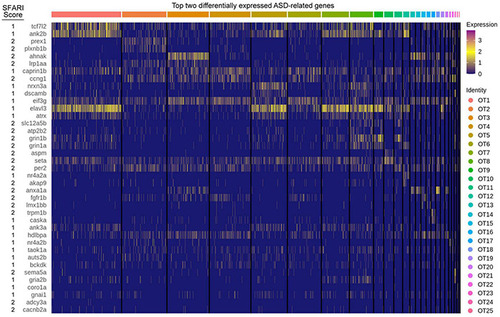
ASD implicated genes are differentially expressed in the larval zebrafish OT. The top two differentially expressed genes implicated in ASD pathogenesis, duplicates are allowed but only displayed once. Score: Indicates ASD association score conferred by SFARI Gene. See |