IMAGE

FIGURE 3

ID
ZDB-IMAGE-220303-5
Source
Figures for Martin et al., 2022
Image
Figure Caption

FIGURE 3

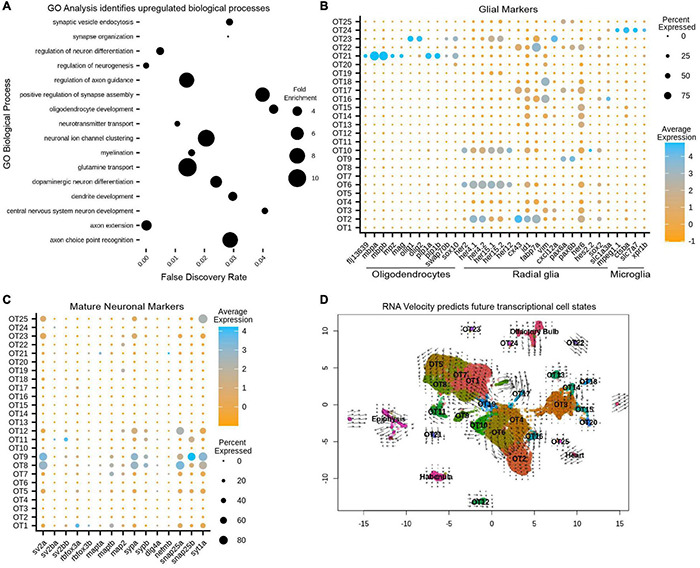
Gene ontology (GO) and RNA velocity analysis reveals upregulated biological processes and predict future transcriptional cell states. (A) Upregulated processes in all 13,320 putative tectal cells. Whole dataset GO analysis was performed on all significant (p < 0.05) differentially expressed genes (see also Supplementary Table 2). Processes of note include regulation of axon guidance, positive regulation of synapse assembly, glutamine transport, and oligodendrocyte development, suggesting the presence of immature/mature neuronal populations and glial cells (see also Supplementary Tables 3, 6). (B) Cluster analysis of glial markers identifies OT21/OT23 as oligodendrocytes; radial glial markers are found in various populations including OT6 and OT10; OT24 is likely microglial (see also Supplementary Table 5). (C) Cluster analysis of manually curated neuronal markers shows several mature populations including OT8 and OT9 (see also Supplementary Table 4). (D) RNA velocity with original UMAP cluster embeddings. Shorter arrows or dots connote more mature cells. Arrows are vectors where direction indicates the predicted transcriptional state and magnitude indicates the degree of differentiation. BAM files from two temporal replicates were used to generate a matrix containing spliced:unspliced count ratios for each gene, where higher spliced counts indicate a more processed form of the gene and lower spliced counts indicate newly “born” genes.

Acknowledgments
This image is the copyrighted work of the attributed author or publisher, and ZFIN has permission only to display this image to its users. Additional permissions should be obtained from the applicable author or publisher of the image. Full text @ Front. Mol. Neurosci.