IMAGE

FIGURE 5

ID
ZDB-IMAGE-220303-8
Source
Figures for Martin et al., 2022
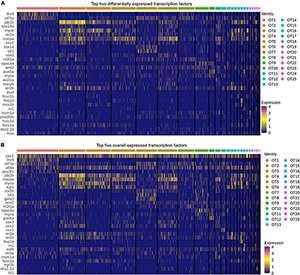
Image
Figure Caption

FIGURE 5

Top transcription factors in the larval zebrafish OT. (A) The top two differentially expressed transcription factors in each OT population as compared to all other cells. (B) Top five expressed transcription factors in each population. (All) Duplicates of top factors are allowed but displayed only once. Factors were considered differentially expressed for a particular cluster if they were expressed > 0.25 log2 fold change above all other cells and are present > 25% of cells within the cluster. Factors were ordered in decreasing expression (log2fc) level and the top two or five were selected for visualization; see Supplementary Table 8 for all transcription factors.

Acknowledgments
This image is the copyrighted work of the attributed author or publisher, and ZFIN has permission only to display this image to its users. Additional permissions should be obtained from the applicable author or publisher of the image. Full text @ Front. Mol. Neurosci.