
IMAGE
FIGURE 4
- ID
- ZDB-IMAGE-220303-6
- Publication
- Martin et al., 2022 - Single-Cell RNA Sequencing Characterizes the Molecular Heterogeneity of the Larval Zebrafish Optic Tectum
- All Figures
- Figures for Martin et al., 2022
Image
|
Figure Caption
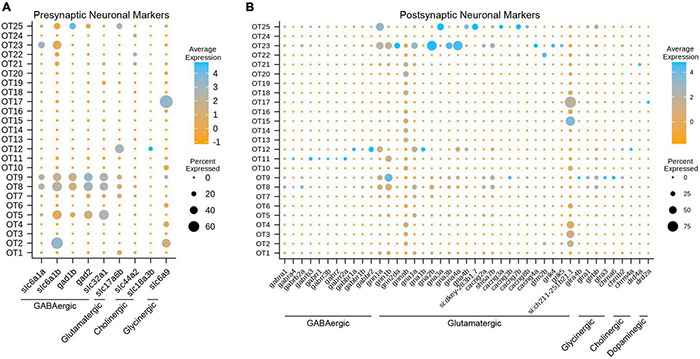
FIGURE 4
Gene expression profiles characterize the neuronal profiles of OT cells.
Acknowledgments
This image is the copyrighted work of the attributed author or publisher, and
ZFIN has permission only to display this image to its users.
Additional permissions should be obtained from the applicable author or publisher of the image.
Full text @ Front. Mol. Neurosci.