
- Title
-
Enteric nervous system modulation of luminal pH modifies the microbial environment to promote intestinal health
- Authors
- Hamilton, M.K., Wall, E.S., Robinson, C.D., Guillemin, K., Eisen, J.S.
- Source
- Full text @ PLoS Pathog.
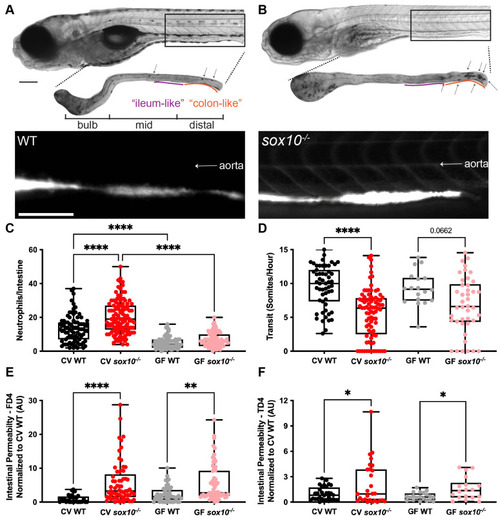
sox10 mutants have decreased intestinal transit and hyperpermeability, independent of intestinal microbially induced inflammation.
Representative bright field and fluorescence microscopy images showing (A) WT, and (B) sox10-/- larvae (top), dissected intestines stained for myeloperoxidase activity to reveal intestinal neutrophils (middle) and after oral microgavage of 4 kD fluorescein dextran (FD4) (bottom). Arrows indicate intestinal neutrophils. (C) Quantification of intestinal neutrophils per mid and distal intestine in CV and GF larvae. (D) Quantification of intestinal transit of phenol red; distance traveled over time measured as somites/hour (GF WT vs GF sox10-/- t-test p = 0.02). Quantification of (E) FD4 and (F) 4 kD tetramethylrhodamine dextran (TD4) permeability measured as fluorescence intensity in aorta. Scale bars = 300μm. AU = arbitrary units. Each dot in C-F is one fish; n>18 for each condition. Boxes in C-F represent the first to third quartiles, center bar denotes the median, and whiskers the maximum and minimum of each dataset. * p < 0.05, **p<0.01, ****p<00001. A and B: ANOVA followed by Tukey’s post hoc test, C and D: Kolmogorov-Smirnov non-parametric t-test. PHENOTYPE:
|

Hyperpermeability in CV sox10 mutants precedes decreased transit and microbial induced inflammation.
(A) Quantification of intestinal neutrophil response. (B) FD4 permeability as measured by fluorescence intensity in aorta. (C) Transit at 4, 5, 6, and 7 dpf. Each dot is a fish; n>18 for each condition. Boxes represent the first to third quartiles, center bar denotes the median, and whiskers the maximum and minimum of each dataset. * p < 0.05, **p<0.01, ****p<00001. A&C: Two-way ANOVA followed by Šídák multiple comparisons test; B: Kolmogorov-Smirnov non-parametric t-test. |
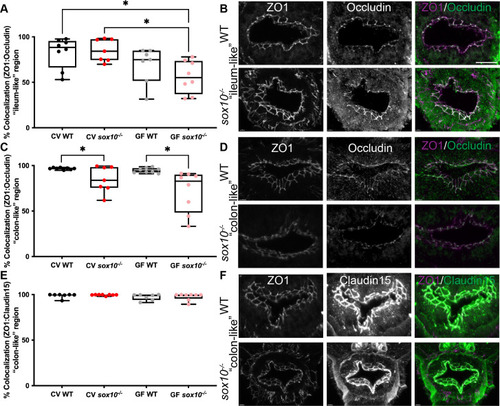
sox10 mutants have altered intestinal tight junctions.
(A) Quantification of percent ZO1 colocalized with Occludin in the “ileum-like” region of CV and GF larvae. (B) Representative immunohistochemistry of CV WT and sox10 mutant ZO1, Occludin and colocalization in “ileum-like” region. (C) Quantification of percent ZO1 colocalized with Occludin in the “colon-like” region of CV and GF larvae. (D) Representative immunohistochemistry of ZO1, Occludin and colocalization in “colon-like” region. (E) Quantification of percent ZO1 colocalized with Claudin-15 in the ‘colon-like” region of CV and GF larvae. (F) Representative immunohistochemistry of ZO1, Claudin-15 and colocalization in “colon-like” region. Scale bar = 20μm. Each point in A, C and E is the average value of 2–3 sections per fish. Staining was performed on larvae from two independent GF derivations (n>7). Boxes represent the first to third quartiles, center bar denotes the median, and whiskers the maximum and minimum of each dataset. * p < 0.05. ANOVA followed by Tukey’s post hoc test. |
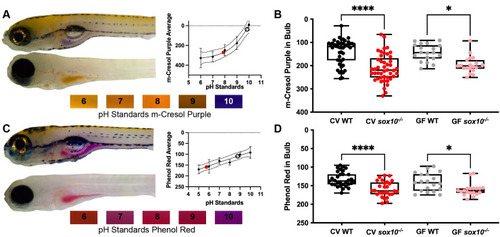
sox10 mutant intestinal lumens are more acidic than wild types.
(A) Top left, representative images of WT (top) and sox10 mutant (bottom) larvae 20 min after m-cresol purple gavage. Bottom, pictures of indicator dyes in sterile embryo medium adjusted to known pHs; graph shows quantification of standards. (B) Quantification of luminal pH in intestinal bulb plotting red + green–blue integer values as described in the Methods. (C) Top left, representative images of WT (top) and sox10 mutant (bottom) larvae 20 min after phenol red gavage. Bottom, pictures of sterile embryo medium adjusted to known pHs; graph shows quantification of standards. (D) Quantification of luminal pH in intestinal bulb plotting red integer values. Integer values correspond with red, green and blue channel pixel intensities between 0 and 255 identified with “RGB measure” Image J plugin (see Methods). (A&C) Each dot is an average of at least 3 replicates of pH standard values. Black circle indicates value of WT representative image and red dot indicates value of sox10-/- representative image. (B&D) Each dot is an individual fish; n>17 for each condition. Boxes represent the first to third quartiles, center bar denotes the median, and whiskers the maximum and minimum of each dataset. * p < 0.05, ****p<00001. ANOVA followed by Tukey’s post hoc test. PHENOTYPE:
|
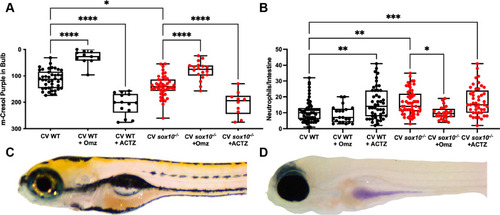
Decreased pH is necessary and sufficient for intestinal hyperinflammation.
(A) Quantification of luminal pH in intestinal bulb plotting red + green–blue integer values (see Methods) of CV WT and sox10 mutants after 24 hour exposure to 200 μM proton pump inhibitor omeprazole (Omz) or carbonic anhydrase inhibitor acetazolamide (ACTZ) 20 min after m-Cresol Purple gavage. (B) Quantification of intestinal neutrophil number per distal intestine in CV WT and sox10 mutants after 24 hour exposure to 200 μM Omz or ACTZ. (C) Representative images of WT after ACTZ treatment and (D) sox10 mutant after Omz treatment. In A & B, each dot is a fish, n>10. Boxes represent the first to third quartiles, center bar denotes the median, and whiskers the maximum and minimum of each dataset. * p < 0.05, **p<0.01, ****p<00001. ANOVA followed by Tukey’s post hoc test. |
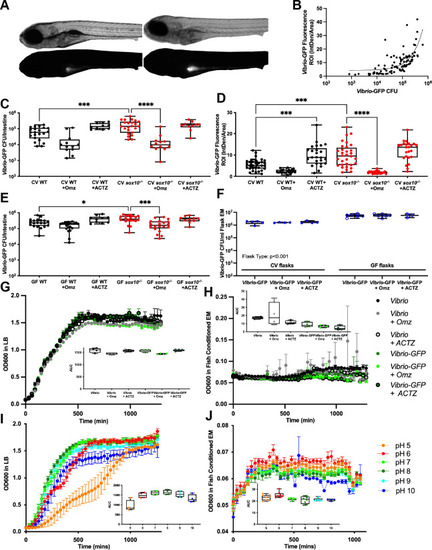
Luminal pH regulates Vibrio abundance.
(A) Representative images of bright field (top) and fluorescence (bottom) showing WT (left) and sox10-/- (right) larvae after 24 hour exposure to Vibrio-GFP. (B) Fluorescence intensity of intestinal lumen correlates with abundance of Vibrio-GFP Colony Forming Units/intestine (CFU/intestine). (C) Quantification of Vibrio-GFP colonization level (CFU/intestine) in CV WT and sox10 mutants after 24 hour exposure to Vibrio-GFP and 200 μM Omz or ACTZ (CV WT vs CV WT+OMZ t-test p = 0.01; CV WT vs CV WT + ACTZ: t-test p = 0.003). (D) Quantification of Vibrio-GFP luminal fluorescent intensity in CV WT and sox10 mutants after 24 hour exposure to Vibrio-GFP and 200 μM Omz or ACTZ (CV WT vs CV WT+OMZ t-test p = <0.0001). (E) Quantification of Vibrio-GFP colonization level (CFU/intestine) in GF WT and sox10 mutants after 24 hour exposure to Vibrio-GFP and 200 μM Omz or ACTZ (CV WT vs CV WT+OMZ t-test p = 0.01; CV WT vs CV WT + ACTZ: t-test p = 0.003). (F) Quantification of Vibrio-GFP colonization level (CFU/mL) in CV and GF flask embryo media (EM) after 24 hour exposure to 200 μM Omz or ACTZ. (G-H) Vibrio and Vibrio-GFP growth curves and area under the curve (AUC) in LB (G) and fish conditioned EM (H) with 200 μM Omz or ACTZ. (I-J) Vibrio growth curves and AUC in controlled pH LB (I) and fish conditioned EM (J). Each dot is a fish; n>12 for each condition (B-E), each dot is a flask (F), each dot is an average absorbance of 4 experimental replicates of at least 2 individual experiments (G&H). Boxes represent the first to third quartiles, center bar denotes the median, and whiskers the maximum and minimum of each dataset. * p < 0.05, **p<0.01, ***p<0.001, ****p<00001. One-way ANOVA followed by Tukey’s post hoc test (C-E). Two-way ANOVA followed by Šídák multiple comparisons test (F). EXPRESSION / LABELING:
PHENOTYPE:
|

Proposed model of luminal pH driven intestinal pathology.
(A) WT larvae with an ENS maintain luminal pH in GF and CV conditions. WT CV larvae maintain a healthy balance of microbiota and surveying neutrophils. ACTZ treatment of CV WT larvae decreases luminal pH, driving increased proinflammatory Vibrio abundance and neutrophil influx. (B) sox10 mutants lacking the ENS have decreased intestinal transit, hyperpermeability, and decreased luminal pH in both GF and CV conditions. Decreased luminal pH promotes an increase in proinflammatory Vibrio leading to increased neutrophils and a hyper-inflammatory state. Omz treatment to CV sox10 mutants increases luminal pH, resulting in decreased Vibrio abundance and ameliorated hyperinflammation. Model created with BioRender.com. |