
Fig 6
- ID
- ZDB-FIG-220214-24
- Publication
- Hamilton et al., 2022 - Enteric nervous system modulation of luminal pH modifies the microbial environment to promote intestinal health
- Other Figures
- All Figure Page
- Back to All Figure Page
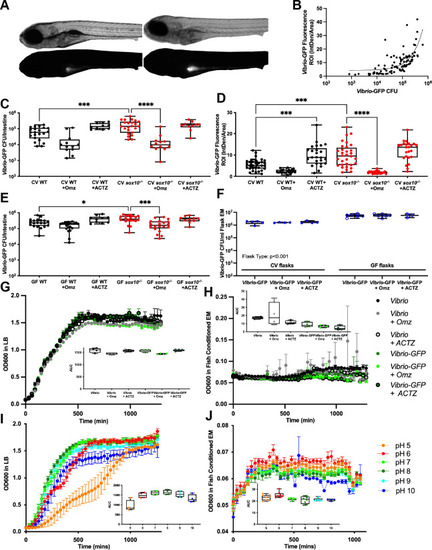
Luminal pH regulates Vibrio abundance.
(A) Representative images of bright field (top) and fluorescence (bottom) showing WT (left) and sox10-/- (right) larvae after 24 hour exposure to Vibrio-GFP. (B) Fluorescence intensity of intestinal lumen correlates with abundance of Vibrio-GFP Colony Forming Units/intestine (CFU/intestine). (C) Quantification of Vibrio-GFP colonization level (CFU/intestine) in CV WT and sox10 mutants after 24 hour exposure to Vibrio-GFP and 200 μM Omz or ACTZ (CV WT vs CV WT+OMZ t-test p = 0.01; CV WT vs CV WT + ACTZ: t-test p = 0.003). (D) Quantification of Vibrio-GFP luminal fluorescent intensity in CV WT and sox10 mutants after 24 hour exposure to Vibrio-GFP and 200 μM Omz or ACTZ (CV WT vs CV WT+OMZ t-test p = <0.0001). (E) Quantification of Vibrio-GFP colonization level (CFU/intestine) in GF WT and sox10 mutants after 24 hour exposure to Vibrio-GFP and 200 μM Omz or ACTZ (CV WT vs CV WT+OMZ t-test p = 0.01; CV WT vs CV WT + ACTZ: t-test p = 0.003). (F) Quantification of Vibrio-GFP colonization level (CFU/mL) in CV and GF flask embryo media (EM) after 24 hour exposure to 200 μM Omz or ACTZ. (G-H) Vibrio and Vibrio-GFP growth curves and area under the curve (AUC) in LB (G) and fish conditioned EM (H) with 200 μM Omz or ACTZ. (I-J) Vibrio growth curves and AUC in controlled pH LB (I) and fish conditioned EM (J). Each dot is a fish; n>12 for each condition (B-E), each dot is a flask (F), each dot is an average absorbance of 4 experimental replicates of at least 2 individual experiments (G&H). Boxes represent the first to third quartiles, center bar denotes the median, and whiskers the maximum and minimum of each dataset. * p < 0.05, **p<0.01, ***p<0.001, ****p<00001. One-way ANOVA followed by Tukey’s post hoc test (C-E). Two-way ANOVA followed by Šídák multiple comparisons test (F). |
| Fish: | |
|---|---|
| Conditions: | |
| Observed In: | |
| Stage: | Day 6 |