
IMAGE
Fig 2
- ID
- ZDB-IMAGE-220214-22
- Publication
- Hamilton et al., 2022 - Enteric nervous system modulation of luminal pH modifies the microbial environment to promote intestinal health
- All Figures
- Figures for Hamilton et al., 2022
Image
|
Figure Caption
Fig 2
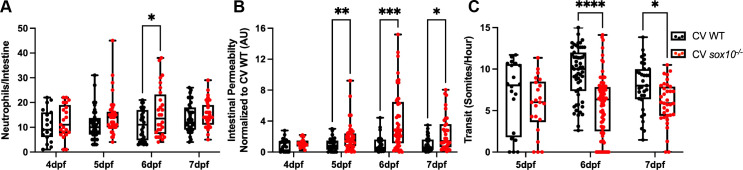
Hyperpermeability in CV sox10 mutants precedes decreased transit and microbial induced inflammation.
(A) Quantification of intestinal neutrophil response. (B) FD4 permeability as measured by fluorescence intensity in aorta. (C) Transit at 4, 5, 6, and 7 dpf. Each dot is a fish; n>18 for each condition. Boxes represent the first to third quartiles, center bar denotes the median, and whiskers the maximum and minimum of each dataset. * p < 0.05, **p<0.01, ****p<00001. A&C: Two-way ANOVA followed by Šídák multiple comparisons test; B: Kolmogorov-Smirnov non-parametric t-test.
Figure Data
Acknowledgments
This image is the copyrighted work of the attributed author or publisher, and
ZFIN has permission only to display this image to its users.
Additional permissions should be obtained from the applicable author or publisher of the image.
Full text @ PLoS Pathog.