
- Title
-
Bistable Photoswitch Allows in Vivo Control of Hematopoiesis
- Authors
- Albert, L., Nagpal, J., Steinchen, W., Zhang, L., Werel, L., Djokovic, N., Ruzic, D., Hoffarth, M., Xu, J., Kaspareit, J., Abendroth, F., Royant, A., Bange, G., Nikolic, K., Ryu, S., Dou, Y., Essen, L.O., V�zquez, O.
- Source
- Full text @ ACS Cent Sci

Design and synthesis of CS-VIPs. (A) Photoswitchable MM-401 cyclopeptides. (B) Exemplified synthesis for CS-VIP 8. (i) 1.00 equiv Pd(PPh3)4, 190 equiv morpholine, DCM, 2 h, rt; (ii) 4.00 equiv Oxyma, 4.00 equiv DIC, 4.00 equiv Mtt-oF4Azo, DMF, 45 min, rt; (iii) HFIP/DCM 1:4, 2 h, rt; (iv) 3.00 equiv HATU, 4.00 equiv DIPEA, THF/DMF 98:2, 45 min, rt, at 520 nm 3 min; (v) 4 M HCl in dioxane, 3 h, rt; d-Dap d-diaminopropionic acid, d-Dab d-diaminobutyric acid, Abu aminobutyric acid, SPPS solid phase peptide synthesis. |

Photoisomerization studies of CS-VIP 8 and interaction with WDR5. (A) Isomerization of CS-VIP 8. (B) UV?vis spectra in aqueous solution after irradiation at 405 and 520 nm reaching the PSS. (C) Reversible cis:trans cycles by alternating illumination at 405 (blue)/520 (green) nm. (D and E) Stability of the cis-isomer at the 520 nm PSS and the trans one at the 405 nm PSS, respectively, at rt in water via HPLC measurements. (F) Results of FP-based assays obtained by generating 405 and 520 nm PSS considering only the residual 10% of the cis isomer present in solution (yellow) and compared with the cis-state as obtained by illumination at 520 nm (green) including calculated Ki. |

Structural characterization of WDR5?CS-VIP 8 interaction. (A) Co-crystal structures of WDR5?CS-VIP 8 complexes: overlay of cis1 (CS-VIP 8: yellow) and cis2 (CS-VIP 8: green) crystals. (B and C) WDR5-binding site for CS-VIP 8 in crystal 1 (cis1) and in crystal 2 (cis2), respectively. (D) WDR5 apo-structure as generated by 405 nm illumination after crystallization. The shown Fobs,1 ? Fobs,2 difference electron density (red, contouring level 2?) was calculated for cis1-apo states using phases of the cis1 complex. Notably, Phe133 and Phe149 (marine blue apo; light cyan cis1) adopt a different conformation upon CS-VIP 8 release. (E) Absorbance spectra of frozen WDR5 cocrystals recorded at the icOS Lab. (F) Binding site of the cryo-trapped structure from E; CS-VIP 8 is colored as the B-factors range from 13 (blue) to 32 A2 (red); the SIGMAA-weighted 2mFobs ?DFcalc electron density (gray) is shown at a contouring level of 2?. |
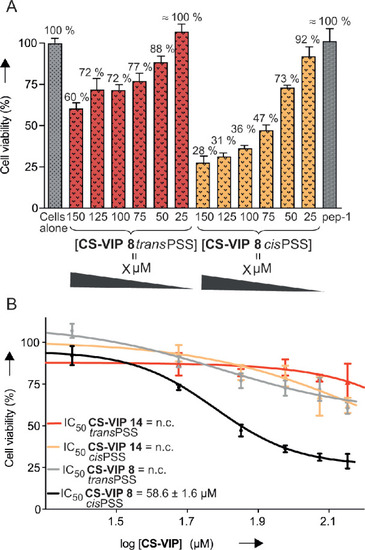
Dose?response toxicity of CS-VIPs on leukemia MOLM-13 cells. (A) Cell viability with both CS-VIP 8 isomeric states for 2-day incubation; X: corresponding concentration. (B) IC50 determination of CS-VIP 8 and CS-VIP 14 in different isomeric states. All mean data points and standard deviations are derived from two independent experiments, and each concentration is in triplicate; n.c. not calculable. |
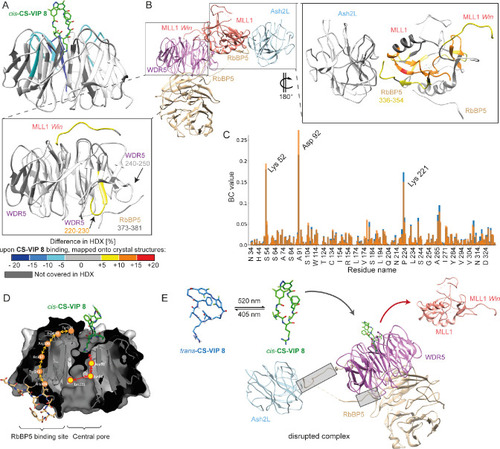
MLL1 complex disruption triggered by CS-VIP 8 binding to WDR5 evaluated via HDX-MS and MD-studies. (A) Difference in D-uptake in WDR5 alone vs bound to cis-CS-VIP 8 mapped onto our crystal structure (PDB: 7AXP). (B) 4-mer MLL1 complex structure (PDB: 6KIU);32 WDR5 light purple, MLL1 salmon, RbBP5 tan, Ash2L light blue. (insets) Zoomed-in difference in D-uptake between with(out) CS-VIP 8 addition mapped onto crystal structures of WDR5-MLL1-Win-RbBP5 (PDB: 3P4F)31 and MLL1-RbBP5-Ash2L (PDB: 5F6L).33 Dark gray regions represent amino acids that have not been covered in the HDX coverage map. (C) Betweenness-centrality (BC) values observed for MLL1-Win-WDR5-RbBP5 peptide (orange bars) and the cis-CS-VIP 8?WDR5-RbBP5 peptide (blue bars). (D) Schematic representation of CS-VIP 8 mode of action displaying shortest paths connecting MLL1 and RbBP5 binding sites of residue interaction network identified through network analysis. (E) Model of CS-VIP 8 mode of action. Gray boxes highlight altered interaction interfaces. |
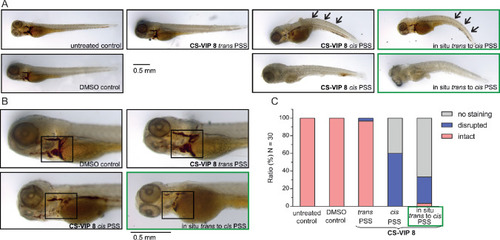
In vivo optochemical inhibition of hematopoiesis in 3-day postfertilization (dpf) zebrafish larvae. (A) Microscopy images of 3-dpf larvae incubated with 500 ?M of CS-VIP 8 at each PSS and controls. (B) Magnified micrographs of the heart region. (C) Bar chart comparing the blood flow of larvae incubated with CS-VIP 8 and controls via analysis of o-dianisidine staining patterns, mean of three independent measurements. Arrows and rectangles highlight phenotypic changes. |