
|
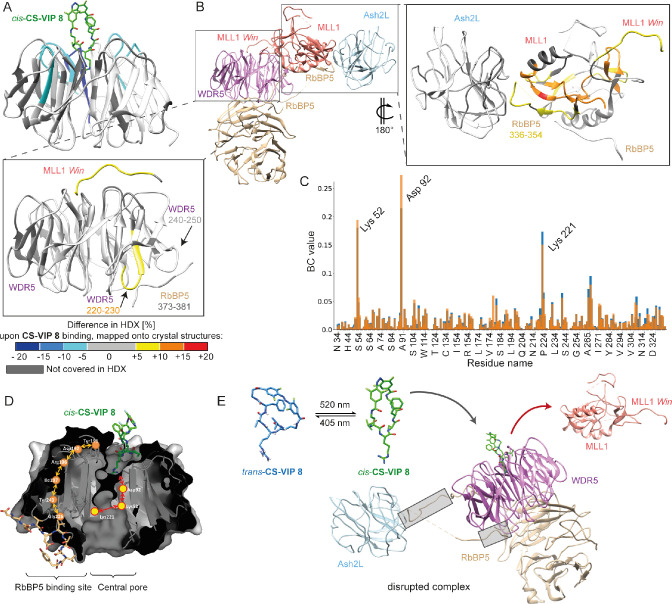
Fig. 5
MLL1 complex disruption triggered by CS-VIP 8 binding to WDR5 evaluated via HDX-MS and MD-studies. (A) Difference in D-uptake in WDR5 alone vs bound to cis-CS-VIP 8 mapped onto our crystal structure (PDB: 7AXP). (B) 4-mer MLL1 complex structure (PDB: 6KIU);32 WDR5 light purple, MLL1 salmon, RbBP5 tan, Ash2L light blue. (insets) Zoomed-in difference in D-uptake between with(out) CS-VIP 8 addition mapped onto crystal structures of WDR5-MLL1-Win-RbBP5 (PDB: 3P4F)31 and MLL1-RbBP5-Ash2L (PDB: 5F6L).33 Dark gray regions represent amino acids that have not been covered in the HDX coverage map. (C) Betweenness-centrality (BC) values observed for MLL1-Win-WDR5-RbBP5 peptide (orange bars) and the cis-CS-VIP 8•WDR5-RbBP5 peptide (blue bars). (D) Schematic representation of CS-VIP 8 mode of action displaying shortest paths connecting MLL1 and RbBP5 binding sites of residue interaction network identified through network analysis. (E) Model of CS-VIP 8 mode of action. Gray boxes highlight altered interaction interfaces.