
- Title
-
Ophiopogonin B alleviates cisplatin resistance of lung cancer cells by inducing Caspase-1/GSDMD dependent pyroptosis
- Authors
- Cheng, Z., Li, Z., Gu, L., Li, L., Gao, Q., Zhang, X., Fu, J., Guo, Y., Li, Q., Shen, X., Chen, M., Zhang, X.
- Source
- Full text @ J Cancer

OP-B had more significant effect on inhibiting A549/DDP cells and its transplantation tumor growth than that in A549 cells. A. Chemical structure of OP-B. B. CCK8 assay tested the resistance index of A549/PTX (a) and A549/DDP (b) cells. C. Cell inhibition rate of NCI-H460, A549, A549/PTX and A549/DDP cells treated by OP-B for 24 (a) and 48 h (b). D. CCK8 assay tested inhibitory effect of OP-B combined with DDP on A549 and A549/DDP cells for 24 h. E. Changes of body weight in mice with A549 (a) and A549/DDP (b) transplantation tumor after treated with OP-B for 25 days. F. Changes of A549 (a) and A549/DDP (b) transplantation tumor volume after treated with OP-B for 25 days. G. Tumor inhibition rate of A549 (a) and A549/DDP (b) after treated with OP-B for 25 days. H. The comparison of tumor inhibition rate between A549 and A549/DDP xenograft after treated with OP-B for 25 days. The bars and error bars indicate the mean ± SD. *p < 0.05, **p < 0.01, ***p < 0.005, ****p < 0.001 |

OP-B also had a significant inhibitory effect on A549/DDP carcinoma in situ in mice and transplanted tumors in zebrafish. A. Bioluminescent imaging and quantification of photon flux of 3 mg/kg OP-B treated groups with right lung parenchyma injection of luciferase-marked A549 and A549/DDP cells. B. Before and after OP-B treatment, the fluorescence intensity changes on model and OP-B groups of A549 and A549/DDP. C. Tumor growth rate of A549 (a) and A549/DDP (b) calculated according to the fluorescence intensity data. D. Comparison of tumor growth rates between A549 and A549/DDP. E. Representative images taken by fluorescence stereomicroscope of the zebra fish that were injected with A549 and A549/DDP cells and treated with 5 μM OP-B for 3 days. F. Relative fluorescence intensity of A549 (a) and A549/DDP (b) tumor in zebra fish after OP-B treatment. G. Comparison of tumor growth rate between A549 and A549/DDP that calculated according to the fluorescence intensity data. The bars and error bars indicate the mean ± SD. *p < 0.05, **p < 0.01, ***p < 0.005, ****p < 0.001 |
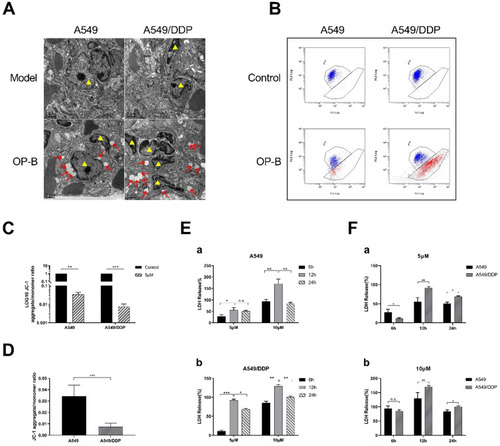
OP-B caused significant pyroptosis in A549/DDP cells. A. Transmission electron microscope images of tissue of tumor in situ (A549 and A549/DDP) after 3 mg/kg OP-B treatment for 14 days (Yellow triangles represent tumor cells). B-D. Mitochondrial membrane potential of A549 and A549/DDP cells was detected by flow cytometry after 5 μM OP-B treatment for 24 h. E-F. The level of LDH release in A549 (a) and A549/DDP (b) cells treated with different concentrations of OP-B after 6 h,12 h and 24 h.The bars and error bars indicate the mean ± SD. *p < 0.05, **p < 0.01, ***p < 0.005, ****p < 0.001 |
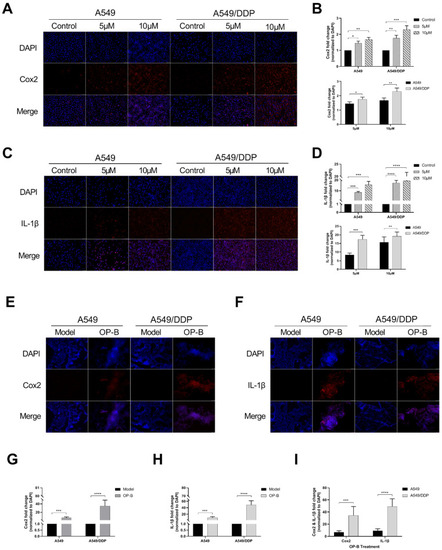
OP-B induced obvious pyroptosis in A549/DDP cancer in vitro and in vivo. A. Immunofluorescence staining of Cox2 expression in A549 and A549/DDP cells with different doses of OP-B treatment. B. Cox2 expression in A549 and A549/DDP cells treated with different concentration of OP-B. C. Immunofluorescence staining of IL-1β expression in A549 and A549/DDP cells with different concentrations of OP-B treatment. D. IL-1β expression in A549 and A549/DDP cells treated with different concentrations of OP-B. E. Immunofluorescence staining of Cox2 expression in different types of tumors in situ. F. Immunofluorescence staining of IL-1β expression in different types of tumors in situ. G. Cox2 expression in different types of tumors in situ. h IL-1β expression in different types of tumors in situ. i IL-1β and Cox2 expression in different types of tumors in situ. The bars and error bars indicate the mean ± SD. *p < 0.05, **p < 0.01, ***p < 0.005, ****p < 0.001 |

RNA sequencing results reveal differentially expressed genes (DEGs) and enriched KEGG pathways in A549/DDP cells treated with or without OP-B. A. Volcano plot (bottom) showing 690 decreased genes and 1149 upregulated genes. B. Venn diagram showing DEGs between A549/DDP cells treated with or without OP-B. C. Top enriched KEGG pathways for these 652 DEGs, including pyroptosis signaling. D. Transcriptiomic RNA-seq identified 1839 DEGs. Hierarchical cluster analysis (top) of significantly differentially expressed mRNAs between A549/DDP cells treated with or without OP-B. |

OP-B induced pyroptosis of A549/DDP cells by activating Caspase-1/GSDMD pathway. A-B. mRNA (pro-Caspase-1, Caspase-1, IL-1β, GSDMD, GSDMD-N and NLRP3) expression determined by qRT-PCR analysis in A549 and A549/DDP cells treated with different doses of OP-B. C. Protein (Caspase-1, GSDMD, GSDMD-N, NLRP3 and β-actin) expression determined by western blot analysis in A549 and A549/DDP cells treated with different concentrations of OP-B. D. Protein (Caspase-1, GSDMD, GSDMD-N and β-actin) expression determined by western blot analysis in A549 and A549/DDP cells treated with the inhibitor of VX765.E-F. Four kinds of protein expression level in A549 and A549/DDP cells treated with different concentrations of OP-B. G. Three kinds of protein expression level in A549 (a) and A549/DDP (b) cells treated with inhibitor of VX765. H. Representative images showing haematoxylin and eosin staining of lung samples from the different groups. I. GSDMD-N expression in the tissue of lungs of the different groups. The bars and error bars indicate the mean ± SD. *p < 0.05, **p < 0.01, ***p < 0.005, ****p < 0.001 |
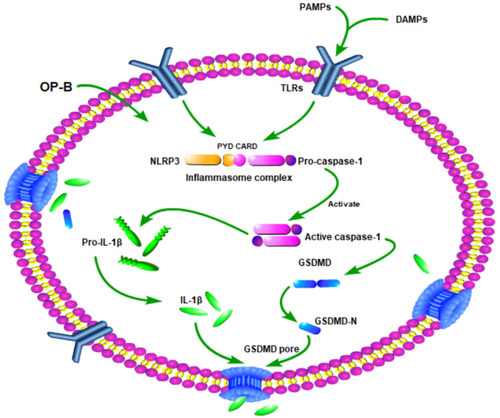
Schematic diagram of mechanism of this research. OP-B induced A549/DDP cells pyroptosis by Caspase-1/GSDMD signal pathway. |