
- Title
-
Neuroprotective effect of YIAEDAER peptide against Parkinson's disease like pathology in zebrafish
- Authors
- Ren, Q., Jiang, X., Zhang, S., Gao, X., Paudel, Y.N., Zhang, P., Wang, R., Liu, K., Jin, M.
- Source
- Full text @ Biomed. Pharmacother.
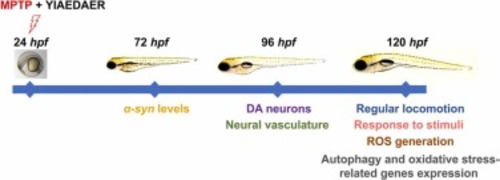
Fig. 1. The experimental workflow chart. Larvae at 24 hpf were co-exposed to MPTP and three different concentrations of YIAEDAER from 24 hpf to 72 hpf, 96 hpf or 120 hpf. At 72 hpf we evaluated expression of α-syn levels. At 96 hpf we evaluated DA neurons and neural vasculature in zebrafish larvae. At 120 hpf co-treated zebrafish were subjected to regular locomotion, response to stimuli, ROS generation detection and performed for autophagy and oxidative stress-related genes expression. |
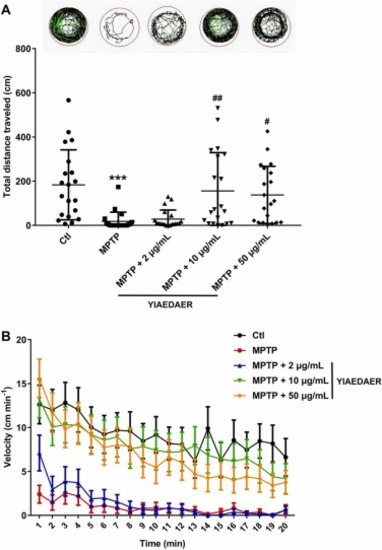
Fig. 2. The relieving effect of YIAEDAER on PD-like behavior in zebrafish larvae. (A) Motion track, Low-speed (v<2 cm/s) movement is represented in black lines, medium-speed (2 cm/s < v < 5 cm/s) movement is depicted in green lines, and high-speed (v>5 cm/s) movement is represented in red lines. The total distance traveled of each zebrafish was analyzed by zeblab software (n = 20). *** P < 0.001 vs Ctl; #P < 0.05, ##P < 0.01 vs MPTP. (B) Average swimming speed of zebrafish larvae with different treatment. Average speed in every 1 min was calculated. |

Fig. 3. Effect of YIAEDAER co-treatment on response impairment to stimuli in zebrafish larvae. Black and white band areas on the x-axis indicate dark and light periods, respectively. The average swimming speed of zebrafish under 3 cycles of light and dark phase (10 min for each phase). Data are presented as mean ± SEM, n = 32 animals per group. |

Fig. 4. The protective effect of YIAEDAER on DA neurons and blood vessels in zebrafish PD model. (A) Representative fluorescence images of Vmat2: GFP zebrafish. Display enlarged image to improve the visualization of DA neuron morphology, red brackets indicate DA neurons. Scale bar, 100 µm. (B) The length of DA neurons in different treatment groups (ratio to control, %) (n = 8). *** P < 0.001 vs Ctl; ##P < 0.01, ###P < 0.001 vs MPTP. (C) Fluorescence of DA neuron region (ratio to control, %) (n = 8). *** P < 0.001 vs Ctl; #P < 0.05, ###P < 0.001 vs MPTP. (D) Representative fluorescence images of Fli1: GFP zebrafish in different treatment groups, red arrows indicate the loss of cerebral vessels. Co-treatment with YIAEDAER peptides protected the loss of vasculature and disorganized vasculature induced by MPTP as indicated by blue arrows. Scale bar, 100 µm. (E) Statistical analysis of the number of integral blood vessels in the brain (n = 8). *** P < 0.001 vs Ctl; #P < 0.05, ##P < 0.01 vs MPTP. |
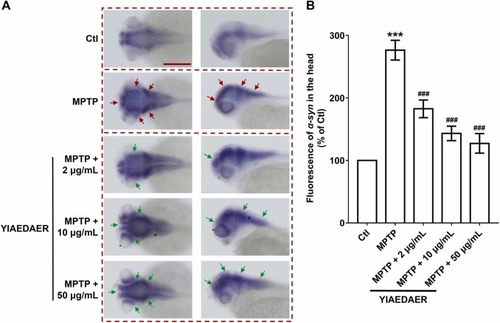
Fig. 5. The relieving effect of YIAEDAER on PD-like symptoms through regulating α-syn levels in zebrafish larvae. (A) The expression of α-syn in the CNS of zebrafish larval after treated with YIAEDAER. Red and green arrows indicate increased and decreased expression of α-syn, respectively. Scale bar, 200 µm. (B) Statistical analysis of the fluorescence of α-syn in different treatment groups (ratio to control, %) (n = 8). *** P < 0.001 vs Ctl; ###P < 0.001 vs MPTP. |

Fig. 6. The role of YIAEDAER on ROS generation in zebrafish PD model. (A) Fluorescence images of ROS generation in zebrafish larvae treated with control; MPTP; 2, 10 and 50 µg/mL YIAEDAER with exposure of PTZ. Scale bar, 500 µm. (B) The fluorescence intensities of ROS levels in individual zebrafish larvae were quantified (n = 8). *** P < 0.001 vs Ctl; ###P < 0.001 vs MPTP. |

Fig. 7. The expression of genes related to autophagy after the treatment of YIAEDAER. The mRNA levels of genes involved in autophagy after the treatment of YIAEDAER. α-syn (A), pink1 (B), parkin (C), atg5 (D), atg7 (E), beclin1 (F), ulk1b (G), ulk2 (H), ambra1a (I). Data were represented as mean ± SEM, n = 3, and statistically analyzed by one-way ANOVA followed by Dunnett’s multiple comparison test. * P < 0.05, ** P < 0.01, *** P < 0.001 vs Ctl; #P < 0.05, ##P < 0.01, ###P < 0.001 vs MPTP. |
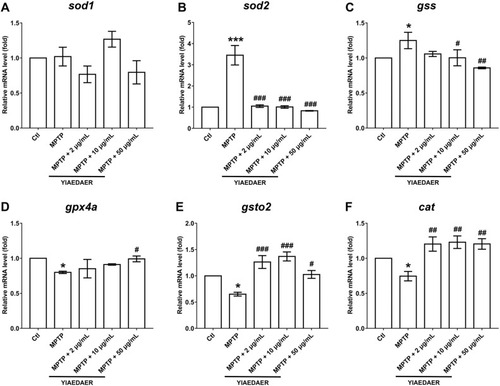
Fig. 8. The expression of genes related to oxidative stress after the treatment of YIAEDAER. The mRNA levels of sod1 (A), sod2 (B), gss (C), gpx4a (D), gsto2 (E), and cat (F) after the treatment of YIAEDAER. Data were represented as mean ± SEM, n = 3, and statistically analyzed by one-way ANOVA followed by Dunnett’s multiple comparison test. * P < 0.05, *** P < 0.001 vs Ctl; #P < 0.05, ##P < 0.01, ###P < 0.001 vs MPTP. |