
Image
|
Figure Caption
Fig. 8
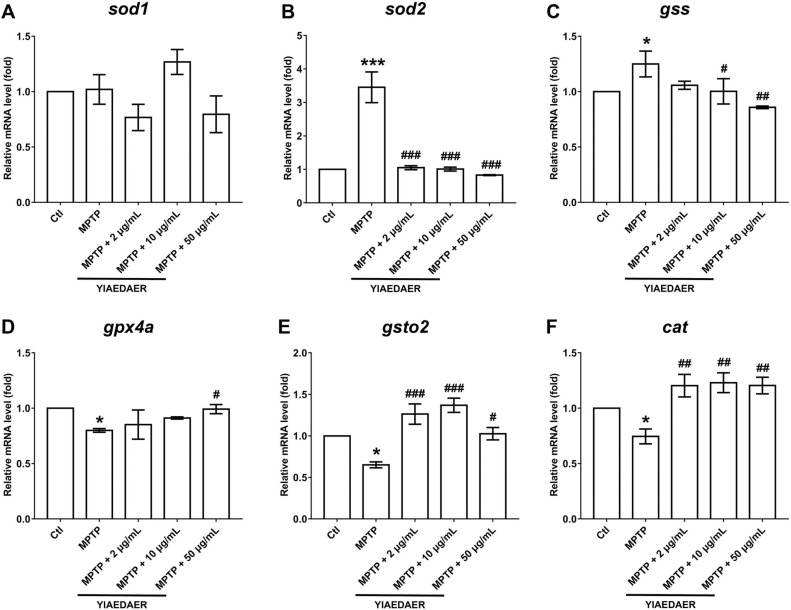
Fig. 8. The expression of genes related to oxidative stress after the treatment of YIAEDAER. The mRNA levels of sod1 (A), sod2 (B), gss (C), gpx4a (D), gsto2 (E), and cat (F) after the treatment of YIAEDAER. Data were represented as mean ± SEM, n = 3, and statistically analyzed by one-way ANOVA followed by Dunnett’s multiple comparison test. * P < 0.05, *** P < 0.001 vs Ctl; #P < 0.05, ##P < 0.01, ###P < 0.001 vs MPTP.
Acknowledgments
This image is the copyrighted work of the attributed author or publisher, and
ZFIN has permission only to display this image to its users.
Additional permissions should be obtained from the applicable author or publisher of the image.
Full text @ Biomed. Pharmacother.