
Image
|
Figure Caption
Fig. 1
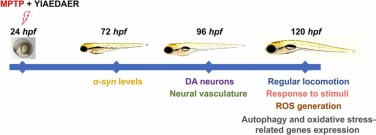
Fig. 1. The experimental workflow chart. Larvae at 24 hpf were co-exposed to MPTP and three different concentrations of YIAEDAER from 24 hpf to 72 hpf, 96 hpf or 120 hpf. At 72 hpf we evaluated expression of α-syn levels. At 96 hpf we evaluated DA neurons and neural vasculature in zebrafish larvae. At 120 hpf co-treated zebrafish were subjected to regular locomotion, response to stimuli, ROS generation detection and performed for autophagy and oxidative stress-related genes expression.
Acknowledgments
This image is the copyrighted work of the attributed author or publisher, and
ZFIN has permission only to display this image to its users.
Additional permissions should be obtained from the applicable author or publisher of the image.
Full text @ Biomed. Pharmacother.