
- Title
-
Single Cell Transcriptomic Analysis of Spinal Dmrt3 Neurons in Zebrafish and Mouse Identifies Distinct Subtypes and Reveal Novel Subpopulations Within the dI6 Domain
- Authors
- Iglesias González, A.B., Jakobsson, J.E.T., Vieillard, J., Lagerström, M.C., Kullander, K., Boije, H.
- Source
- Full text @ Front. Cell. Neurosci.
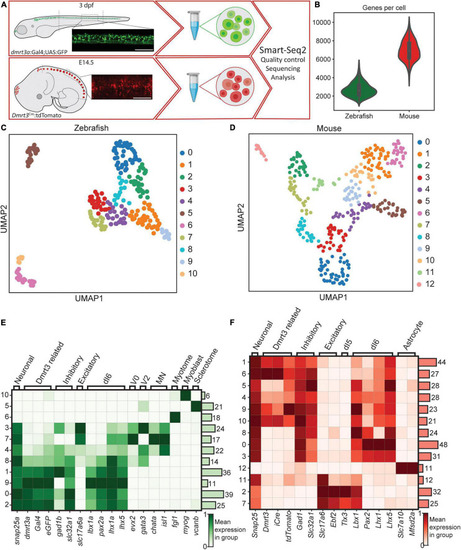
Methodology, the transgenic line, and initial clustering. (A) Parts of the spinal cords were collected for zebrafish and mouse. Lateral images depict fluorescent labeling. Tissues were dissociated and scRNA-seq was performed using Smart-Seq2 protocol. (B) Number of cells detected per cell for zebrafish (green used throughout figures) and for mouse dataset (red used throughout figures). (C) UMAP representation of all cells detected for zebrafish. Individual colors are groups detected by leiden clustering. (D) Same as in (C), but for the mouse dataset. (E,F) Heatmap of gene expression for the detected leiden groups. Genes were selected to detect different cell types and lineages. Zebrafish dataset is shown in (E) and mouse dataset is shown in (F). Color represents the mean gene expression in a particular group of cells. Scale bar in (A) equals 100 μm. |
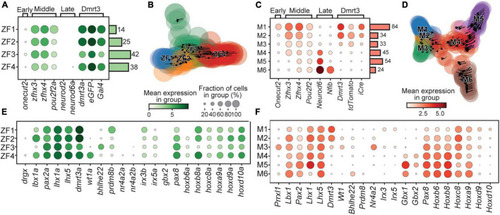
Birth order and rostro-caudal origin of the clusters. Dotplot of genes associated with the time of birth for zebrafish (A) and mouse (C). Stream plots of all cells in the zebrafish (B) and the mouse (D) datasets plotted using diffusion map embedding. Arrows in the plot represents the average velocity of cells in that region. Given time, cells would follow the arrows. (E) Dotplot of transcription factors and lineage associated genes in zebrafish. (F) Same as (E) but for mouse. In dotplots, size of dots represents the proportion of cells in a group that has transcripts for a given gene and the color intensity represents the mean expression level in a group for a given gene. |

Differentially expressed gene in zebrafish and mouse. (A) UMAP representation of all cells retained in the zebrafish dataset. (B–F) UMAP representation and expression of individual genes specific to zebrafish clusters. (G) Heatmap of the most differentially expressed gene in each zebrafish cluster. (H) UMAP representation of all cells retained in the mouse dataset. (I–N) UMAP representation and expression of individual genes specific to mouse clusters. (O) Heatmap of the most differentially expressed gene in each mouse cluster. Color intensity represents the mean expression level in a group for a given gene. |

Immunohistochemical verification of subpopulations. (A) Dorsal view from double labeling of Wt1a and Calretinin in dmrt3a-Gal4;UAS-GFP zebrafish. Images below are magnification of the dashed square. Right: rostral. Left: caudal. (B) Venn diagram showing the total number of cells counted, and their overlap. (C) Double labeling of WT1 and ESRRB in Dmrt3-Cre/tdTomato mouse. Images below are magnification of the dashed square. (D) Venn diagram showing the total number of detected cells, and their overlap. (E) Distribution of Dmrt3, Esrrb, and Wt1 along the dorso-ventral and medio-lateral axis in mouse. Scale bar in (A,C) equals 100 μm. Arrow heads indicate calretinin, eGFP double positive cells in (A) and ESRRB, tdTomato double positive cells in (B), while hollow arrow heads indicate Wt1, eGFP double positive in (A) and WT1, tdTomato double positive in (B). |
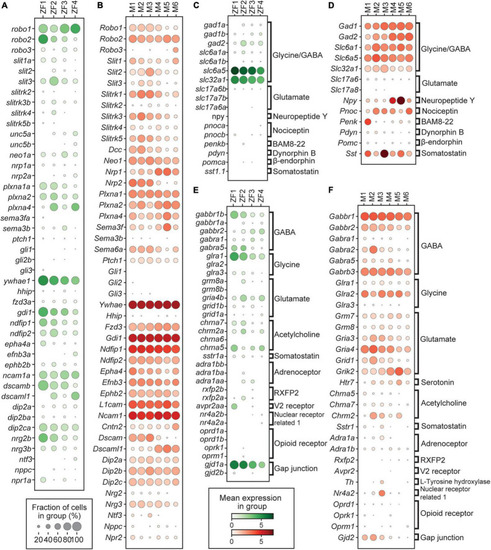
Expression of genes related to axon guidance, neurotransmitters, and their receptors. (A,B) Dotplot of genes related to axon guidance for zebrafish and mouse, respectively. (C,D) Dotplot of genes related to neurotransmitters for zebrafish and mouse, respectively. (E,F) Dotplot of genes related to neurotransmitter receptors for zebrafish and mouse, respectively. In dotplots, size of dots represents the proportion of cells in a group that has transcripts for a given gene and the color represents the mean expression level in a group for a given gene. |

Expression of genes associated with functional properties. Score for genes related to FRmax (A), Rin (B), Vrest (C), and APamp (D) in mouse represented on UMAP embedding. Dotplot of genes related to electrophyiological properties in mouse (E) and fish (F). In dotplots, size of dots represents the proportion of cells in a group that has transcripts for a given gene and the color represents the mean expression level in a group for a given gene. FRmax, maximum firing rate; Rin, input resistance; Vrest, resting membrane potential; APamp, action potential amplitude. |
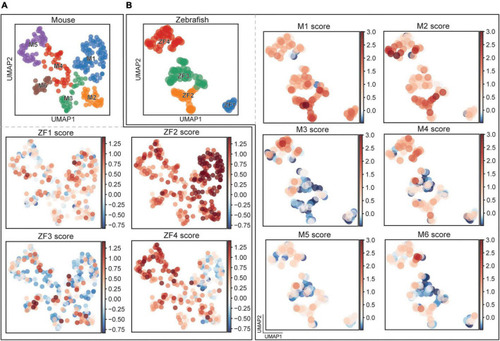
Comparison between mouse and fish clusters. |