
Image
|
Figure Caption
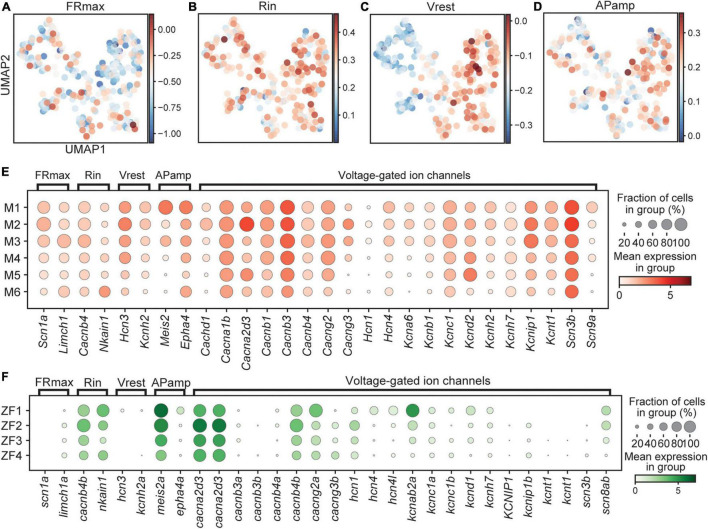
FIGURE 6
Expression of genes associated with functional properties. Score for genes related to FRmax (A), Rin (B), Vrest (C), and APamp (D) in mouse represented on UMAP embedding. Dotplot of genes related to electrophyiological properties in mouse (E) and fish (F). In dotplots, size of dots represents the proportion of cells in a group that has transcripts for a given gene and the color represents the mean expression level in a group for a given gene. FRmax, maximum firing rate; Rin, input resistance; Vrest, resting membrane potential; APamp, action potential amplitude.
Acknowledgments
This image is the copyrighted work of the attributed author or publisher, and
ZFIN has permission only to display this image to its users.
Additional permissions should be obtained from the applicable author or publisher of the image.
Full text @ Front. Cell. Neurosci.