
FIGURE
FIGURE 7
- ID
- ZDB-FIG-220131-251
- Publication
- Iglesias González et al., 2021 - Single Cell Transcriptomic Analysis of Spinal Dmrt3 Neurons in Zebrafish and Mouse Identifies Distinct Subtypes and Reveal Novel Subpopulations Within the dI6 Domain
- Other Figures
- All Figure Page
- Back to All Figure Page
FIGURE 7
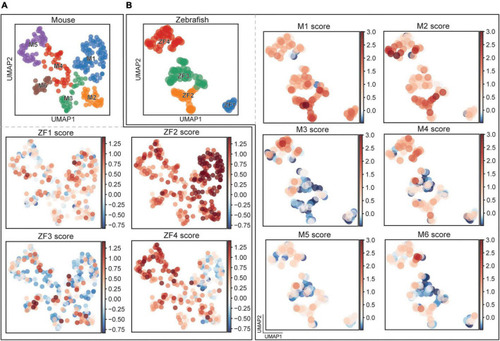
Comparison between mouse and fish clusters. |
Expression Data
Expression Detail
Antibody Labeling
Phenotype Data
Phenotype Detail
Acknowledgments
This image is the copyrighted work of the attributed author or publisher, and
ZFIN has permission only to display this image to its users.
Additional permissions should be obtained from the applicable author or publisher of the image.
Full text @ Front. Cell. Neurosci.