
- Title
-
Riboceine Rescues Auranofin-Induced Craniofacial Defects in Zebrafish
- Authors
- Leask, M., Carleton, C., Leeke, B., Newman, T., Antoun, J., Farella, M., Horsfield, J.
- Source
- Full text @ Antioxidants (Basel)
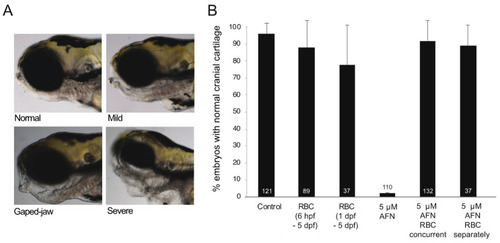
AFN causes craniofacial defects which are rescued by RBC. (A) Representative images of larvae at 5 dpf (lateral view) with normal cartilage (top left) and abnormal cartilage; mild (top right), gaped jaw (bottom left) and severe (bottom right) as a result of 5 μM AFN treatment. (B) Proportion of larvae with normal craniofacial cartilage in untreated controls, RBC (500 µM) exposure 6 hpf–5 dpf, RBC (500 µM) exposure 1–5 dpf, 5 µM AFN only, 5 µM AFN with concurrent exposure to RBC (500 µM) starting at 6 hpf through to 5 dpf, 5 µM AFN with separate exposure to RBC (500 µM) with RBC treatment commencing at 1 dpf through to 5 dpf. Error bars show the standard error of the mean from three biological replicates. Data labels show the total number of larvae observed for each treatment group. Auranofin, AFN; Riboceine, RBC; hours post fertilization, hpf; days post fertilization, dpf. |

Measurements of cartilaginous structures of the zebrafish jaw as assessed by Alcian blue staining. (A) Sagittal view of the head: P—palatoquadrate cartilage, M—Meckels cartilage, d—distance (mm) from P to M, e—extension of M past P. (B) Ventral view of the head: L1—length of Meckels cartilage (mm), L2—Length of ceratohyal cartilage (mm), length of the cartilages was estimated using the Pythagorean formula L = √ (s2 − b2/4). (C) Ventral view of the head: ch—angle of the ceratohyal cartilage. Data for angle of ceratohyal (degrees) (D), ceratohyal length (mm) (E), Meckel’s length (mm) (F) and distance from palatoquadrate to Meckel’s cartilage (mm) (G). Treatment groups; untreated controls, 5 µM AFN and 5 µM AFN with concurrent RBC exposure (6 hpf–5 dpf). Error bars show the standard error of the mean. Mean is the average of six larvae for each treatment group. Asterisk indicates values that are statistically significantly different (p < 0.01) as assessed by one-way ANOVA, Tukey post-hoc analysis. All linear measurements are in mm. Auranofin, AFN; Riboceine, RBC; hours post fertilization, hpf; days post fertilization, dpf. |
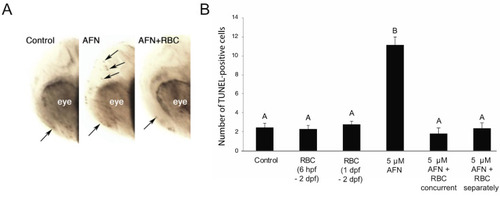
AFN exposure results in apoptosis and rescued by RBC. (A) Images of TUNEL-stained apoptotic cells in the head of embryos at 24 hpf (lateral view) in untreated controls (left) and 5 µM AFN-treated (middle) and RBC + AFN concurrently treated (right) embryos. Arrows indicate TUNEL-positive cells. (B) Number of TUNEL-positive cells in the head of 48 hpf embryos. Treatment groups: untreated controls, RBC (500 µM) exposure starting at 6 hpf, RBC (500 µM) exposure starting at 1 dpf, 5 µM AFN, 5 µM AFN with concurrent RBC exposure (6 hpf–5 dpf) and 5 µM AFN with separate RBC exposure (1 dpf–5 dpf). Error bars are standard error of the mean. Mean is the average of two biological replicates with n = 10 embryos in each treatment group. Data not sharing the same letter are statistically significantly different (p < 0.01) as assessed by one-way ANOVA, Tukey post-hoc analysis. Auranofin, AFN; Riboceine, RBC; hours post fertilization, hpf; days post fertilization, dpf. |
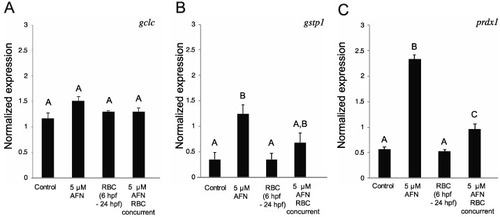
RBC treatment alters AFN-induced antioxidant gene expression response. The normalized expression levels of gclc; (A) gstp1; (B) and prdx1; (C) from untreated controls, RBC (500 µM) exposure (6 hpf–5 dpf), 5 µM AFN at 24 hpf and 5 µM AFN with concurrent RBC exposure (starting at 6 hpf). Error bars are standard error of the mean from three biological replicates (n = 10 embryos in each replicate). Data not sharing a letter are statistically significantly different (p < 0.05) as assessed by one-way ANOVA, Tukey post-hoc analysis. Auranofin, AFN; Riboceine, RBC; hours post fertilization, hpf; days post fertilization, dpf. |