
- Title
-
FAK Regulates VEGFR2 Expression and Promotes Angiogenesis in Triple-Negative Breast Cancer
- Authors
- Shiau, J.P., Wu, C.C., Chang, S.J., Pan, M.R., Liu, W., Ou-Yang, F., Chen, F.M., Hou, M.F., Shih, S.L., Luo, C.W.
- Source
- Full text @ Biomedicines
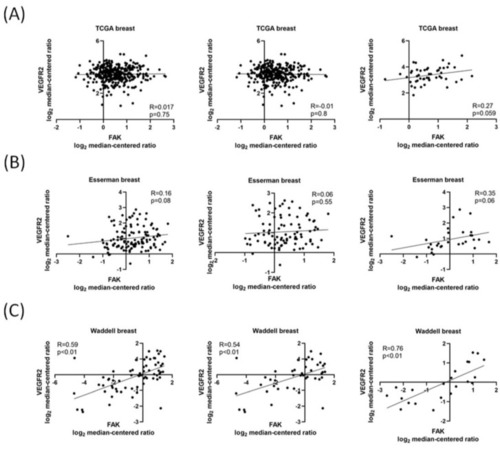
FAK gene expression is positively correlated with VEGFR2 expression in patients with TNBC. Data sets were categorized as “Total breast cancer”, “non-TNBC” (if tumors were positive for either ER, PR, or ERBB2), and “TNBC” (if negative for ER, PR, and ERBB2). These data were obtained from the Oncomine database (https://www.oncomine.com, accessed on 25 July 2021). FAK and VEGFR2 expression were analyzed from (A) TCGA, (B) Esserman breast, and (C) Waddell breast data sets. |
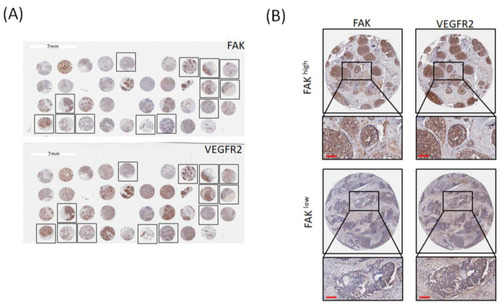
FAK protein expression is correlated with VEGFR2 expression. (A) Representative IHC staining results for expression of FAK and VEGFR2 in breast cancer tissue microarrays. (B) Immunoreactivity of FAK and VEGFR2 was classified as high expression (upper) and low expression (lower) based on staining observed for the cell cytoplasm and membrane. (Scale bar: 100 μm). |
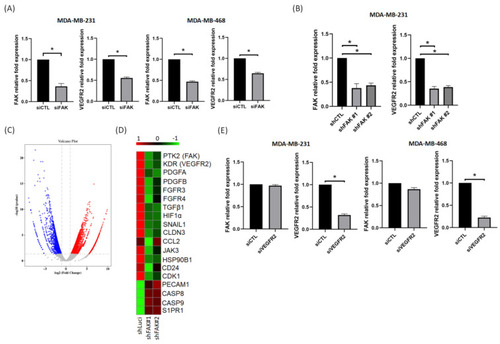
VEGFR2 is regulated through gene expression of FAK in TNBC cells. (A) Knockdown of FAK decreased VEGFR2 gene expression in MDA-MB-231 and MDA-MB-468 cells. (B) VEGFR2 gene expression decreased in two stable knockdown FAK clones. (C) The different gene expressions in shLuci and two shFAK MDA-MB-231 cells from RNA sequencing displayed as a volcano plot. Red marks represent upregulated genes and blue marks represent downregulated genes. (D) Heatmap shows that several angiogenic related gene expressions, such as PTK2, KDR, TGF-β1, HIF-1α, etc., were reduced significantly in shFAK TNBC cells. (E) Knockdown of VEGFR2 expression could not affect FAK gene expression in MDA-MB-231 and MDA-MB-468 cells. Data from three independent experiments were used for statistical analysis and *: p < 0.05. |

VEGFR2 protein expression is modulated through gene regulation by FAK in TNBC cells. (A) Knockdown of FAK decreased protein expressions of VEGFR2, p-FAK, and VEGF but knockdown of VEGFR2 did not affect these protein expressions in MDA-MB-231 and MDA-468 cells. (B) Protein expressions of VEGFR2, p-FAK, and VEGF were reduced in two stable clones of knockdown FAK MDA-Mb-231 cells. (C) VEGFR2 protein expressions in MDA-MB-231 and MDA-MB-468 cells were significant suppressed through PF-562271 treatment. (D) Overexpression of FAK could also increase VEGFR2, p-FAK, and VEGF protein expression in MDA-MB-231 and MDA-MB-468 cells. |

Suppression of FAK affects TNBC cell angiogenesis and tumor growth in vitro and in vivo. (A) Representative images of tube formation in HUVECs treated with CM derived from shLuci MDA-MB-231 cells and shFAK MDA-MB-231 cells. Scale bar: 100 μm. (B) Representative images of tube formation in HUVECs treated with CM derived from MDA-MB-231 cells and PF-562271 treated MDA-MB-231 cells. Scale bar: 100 μm. (C) The sprouts originating from the subintestinal venous plexus in the embryos (the white arrow pointed position) of zebrafish showed that shLuci MDA-MB-231 cells induced tumor angiogenesis, but this was suppressed in shFAK MDA-MB-231 cells. Scale bar: 100 μm. (D) PF-562271 suppressed tumor growth in MDA-MB-231 xenograft mice model (n = 4 for each group). (E) Tumor volume between vehicle and PF-562271 treated groups. Each tumor was from a different mouse. The bar chart represents the quantification of tumor volume from mice (n = 4 for each group). Tumor volume in PF-562271 treated group was significantly smaller than in vehicle treated group. (F) IHC staining represents FAK, p-FAK(Y397), VEGFR2, and CD31 expressions. The expressions of these proteins were reduced in PF-562271 treated group than vehicle treated group. Scale bar: 20 μm. *: p < 0.05. |