
|
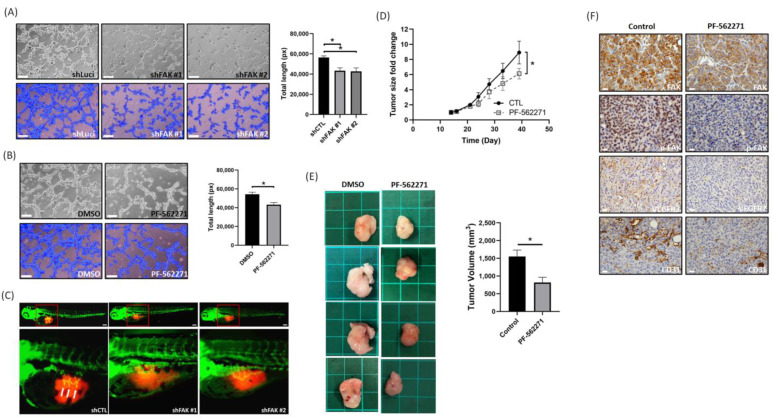
Figure 5
Suppression of FAK affects TNBC cell angiogenesis and tumor growth in vitro and in vivo. (A) Representative images of tube formation in HUVECs treated with CM derived from shLuci MDA-MB-231 cells and shFAK MDA-MB-231 cells. Scale bar: 100 μm. (B) Representative images of tube formation in HUVECs treated with CM derived from MDA-MB-231 cells and PF-562271 treated MDA-MB-231 cells. Scale bar: 100 μm. (C) The sprouts originating from the subintestinal venous plexus in the embryos (the white arrow pointed position) of zebrafish showed that shLuci MDA-MB-231 cells induced tumor angiogenesis, but this was suppressed in shFAK MDA-MB-231 cells. Scale bar: 100 μm. (D) PF-562271 suppressed tumor growth in MDA-MB-231 xenograft mice model (n = 4 for each group). (E) Tumor volume between vehicle and PF-562271 treated groups. Each tumor was from a different mouse. The bar chart represents the quantification of tumor volume from mice (n = 4 for each group). Tumor volume in PF-562271 treated group was significantly smaller than in vehicle treated group. (F) IHC staining represents FAK, p-FAK(Y397), VEGFR2, and CD31 expressions. The expressions of these proteins were reduced in PF-562271 treated group than vehicle treated group. Scale bar: 20 μm. *: p < 0.05.