
Image
|
Figure Caption
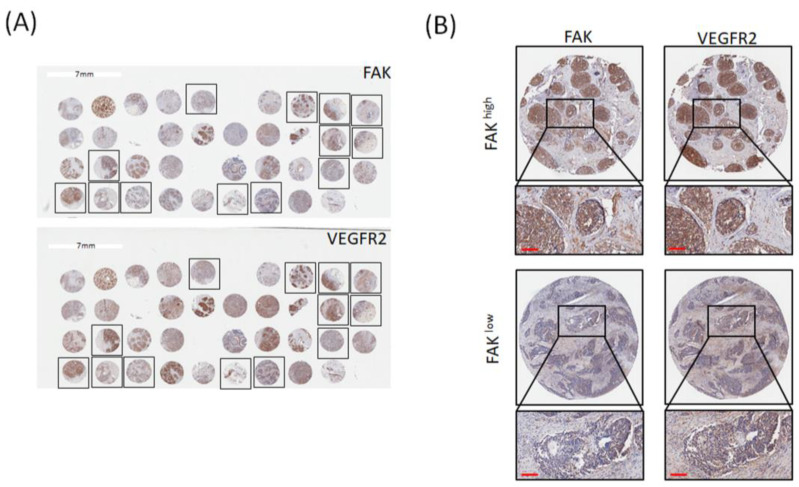
Figure 2
FAK protein expression is correlated with VEGFR2 expression. (A) Representative IHC staining results for expression of FAK and VEGFR2 in breast cancer tissue microarrays. (B) Immunoreactivity of FAK and VEGFR2 was classified as high expression (upper) and low expression (lower) based on staining observed for the cell cytoplasm and membrane. (Scale bar: 100 μm).
Acknowledgments
This image is the copyrighted work of the attributed author or publisher, and
ZFIN has permission only to display this image to its users.
Additional permissions should be obtained from the applicable author or publisher of the image.
Full text @ Biomedicines