
- Title
-
Multimodal Identification by Transcriptomics and Multiscale Bioassays of Active Components in Xuanfeibaidu Formula to Suppress Macrophage-Mediated Immune Response
- Authors
- Zhao, L., Liu, H., Wang, Y., Wang, S., Xun, D., Wang, Y., Cheng, Y., Zhang, B.
- Source
- Full text @ Engineering (Beijing)
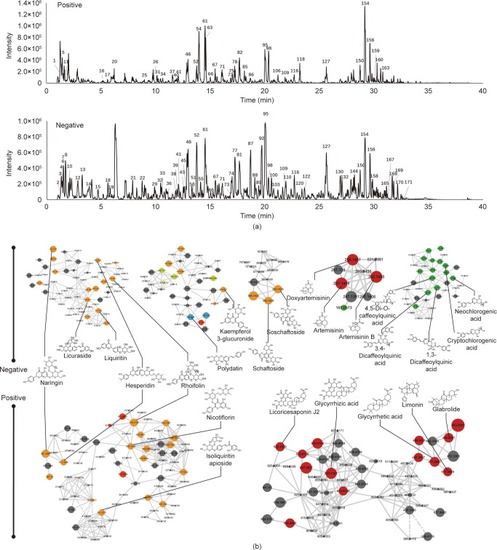
MS-based molecular networking and network pharmacology analysis of XFBD. (a) Base peak mass spectrum of XFBD with positive and negative modes. (b) The main clusters of molecular networking of XFBD. Nodes with different colors represent different compound classifications. Yellow: flavonoid; red: terpenes; green: carboxylic acids; blue: glycosides. |
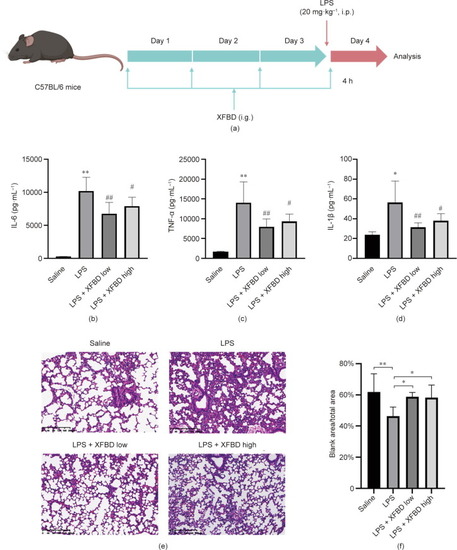
XFBD inhibits LPS-induced acute inflammation in mice. (a) Scheme of XFBD administration and LPS injection. (b–d) Effects of XFBD (high: 4.32 g·kg–1; low: 2.16 g·kg–1) on inflammatory cytokines secretion in serum induced by LPS (20 mg·kg–1 for 4 h). At least six animals were examined in each group (*: |
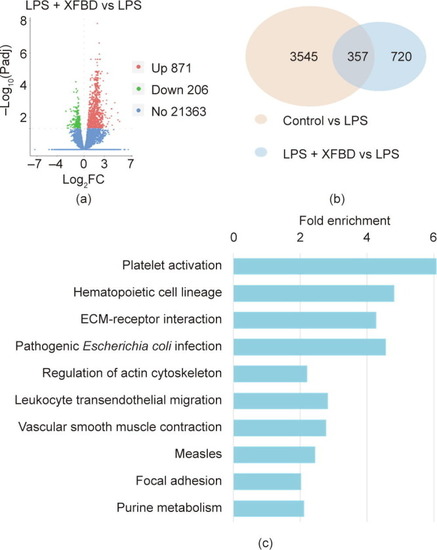
Transcriptomic analysis suggested that XFBD regulates gene expression in multiple infection- and inflammation-related pathways. (a) Counts and distribution of differentially expressed genes (DEGs) of LPS-stimulated mice with or without XFBD treatment. Red: upregulated genes; green: downregulated genes; blue: genes without significant changes. Padj: adjust |
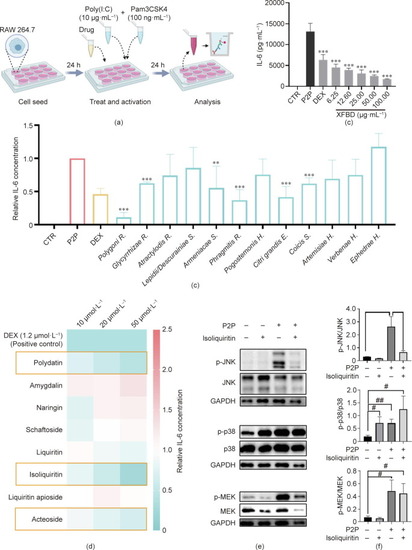
XFBD and its active compounds inhibited macrophage activation |
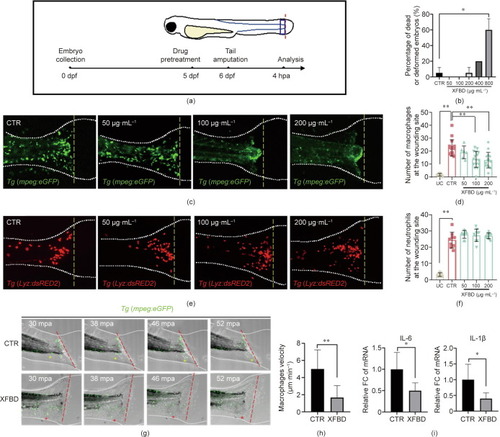
XFBD inhibits inflammation-induced macrophage recruitment in zebrafish. (a) Illustration of the timeline of drug protection and tail amputation. Red dotted line represents the amputation site, and the blue box represents the region for the cell counting of recruited inflammatory cells. (b) Toxicity effects of different doses of XFBD (50–800 μg·mL–1) on fish survival and general development. (c) Representative images and (d) quantification of the accumulation of macrophages at the wounding sites of the control or the XFBD-treated (50–200 μg·mL–1) embryos. (e) Representative images and (f) quantification of the accumulation of neutrophils at the wounding sites of the control or the XFBD-treated (50–200 μg·mL–1) embryos. (g) Time-lapse imaging of macrophage movement in the control and the XFBD-treated (200 μg·mL–1) embryos at indicated times after tail amputation. (h) Quantification of the moving velocity of macrophages. (i) Gene expression of cytokines IL-6 and IL-1β in tail-amputated embryos with or without XFBD (200 μg·mL–1) treatment. White dotted lines outline the fish embryos and yellow (c, e) or red (g) dashed lines mark the transection site. Yellow and red asterisks mark the moving trajectory of the representative macrophages. dpf: days after fertilization; mpa: minutes after amputation, UC: tail-uncutted embryos; CTR: tail-cutted embryos without treatment; XFBD groups: tail-cutted embryos with XFBD treatment of different dosages. *: |
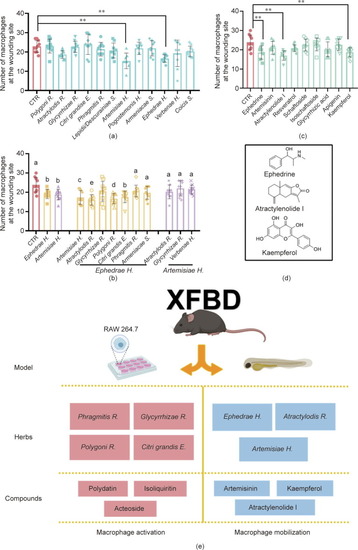
Screen for active herbs, herbal combinations, and compounds of the XFBD recipe in macrophage mobilization. Quantification of the number of macrophages accumulated at the wounding site of embryos treated with (a) different XFBD herb extracts, (b) herb combinations, and (c) compounds. The dosages of each treatment are listed in the Sections 2.9 and 2.11. **: |