
FIGURE
Fig. 1
- ID
- ZDB-FIG-211201-65
- Publication
- Zhao et al., 2021 - Multimodal Identification by Transcriptomics and Multiscale Bioassays of Active Components in Xuanfeibaidu Formula to Suppress Macrophage-Mediated Immune Response
- Other Figures
- All Figure Page
- Back to All Figure Page
Fig. 1
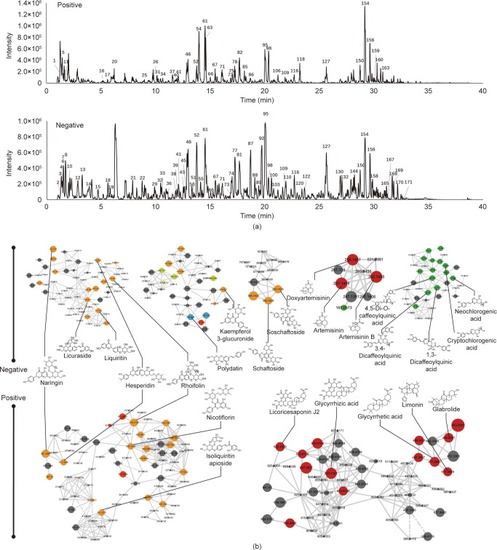
MS-based molecular networking and network pharmacology analysis of XFBD. (a) Base peak mass spectrum of XFBD with positive and negative modes. (b) The main clusters of molecular networking of XFBD. Nodes with different colors represent different compound classifications. Yellow: flavonoid; red: terpenes; green: carboxylic acids; blue: glycosides. |
Expression Data
Expression Detail
Antibody Labeling
Phenotype Data
Phenotype Detail
Acknowledgments
This image is the copyrighted work of the attributed author or publisher, and
ZFIN has permission only to display this image to its users.
Additional permissions should be obtained from the applicable author or publisher of the image.
Full text @ Engineering (Beijing)