IMAGE

Fig. 4

ID
ZDB-IMAGE-211201-68
Source
Figures for Zhao et al., 2021
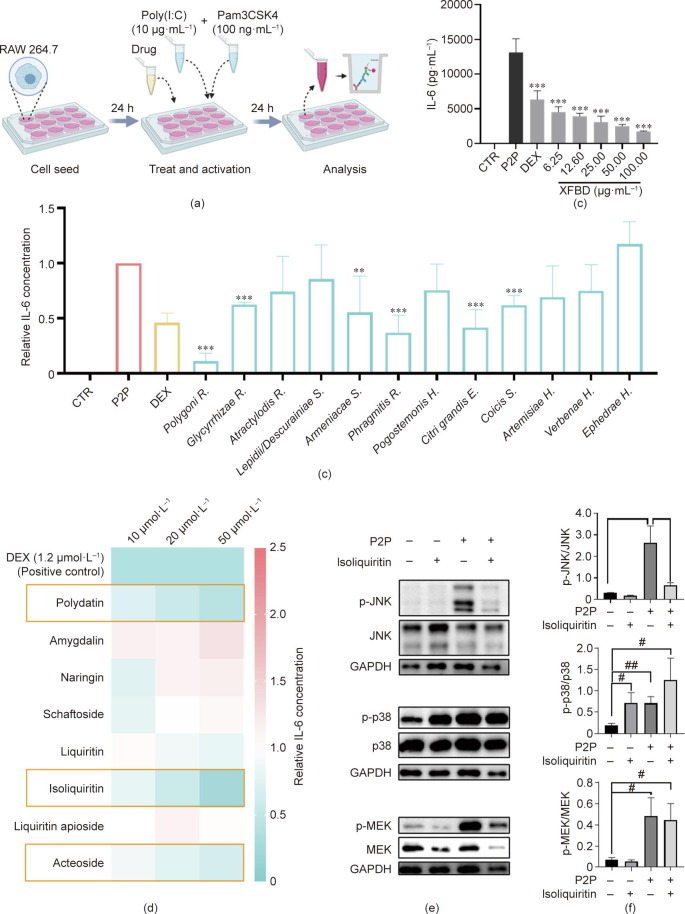
Image
Figure Caption

Fig. 4

XFBD and its active compounds inhibited macrophage activation in vitro. (a) Scheme of macrophage activation and analysis. (b) XFBD extracts of 6.25–100 μg·mL–1 inhibited IL-6 release on the macrophage-activation model in a dose-dependent manner after 24 h of treatment (n = 3, ***: P < 0.001 vs P2P). (c) Protein level of IL-6 in macrophage cells with treatment with different compounds (n = 3, **: P < 0.01, ***: P < 0.001 vs P2P). DEX was used as the positive control. The detailed concentrations of each treatment are listed in the Section 2.9. (d) The effects on IL-6 release of representative XFBD compounds with different doses in the P2P-stimulated macrophage model. The relative IL-6 concentrations were calculated by comparing the value of each compound-treated group with those of the model group. (e, f) Effect of isoliquiritin (50 μmol·L–1) on the phosphorylation of JNK (p-JNK), p38 (p-p38), and MEK (p-MEK). Representative western blots are shown in (e) and statistical graphs are shown in (f) (n = 3; *: P < 0.05 vs P2P; #: P < 0.05, ##: P < 0.01 vs control). CTR: control.

Acknowledgments
This image is the copyrighted work of the attributed author or publisher, and ZFIN has permission only to display this image to its users. Additional permissions should be obtained from the applicable author or publisher of the image. Full text @ Engineering (Beijing)