
IMAGE
Fig. 3
- ID
- ZDB-IMAGE-211201-67
- Publication
- Zhao et al., 2021 - Multimodal Identification by Transcriptomics and Multiscale Bioassays of Active Components in Xuanfeibaidu Formula to Suppress Macrophage-Mediated Immune Response
- All Figures
- Figures for Zhao et al., 2021
Image
|
Figure Caption
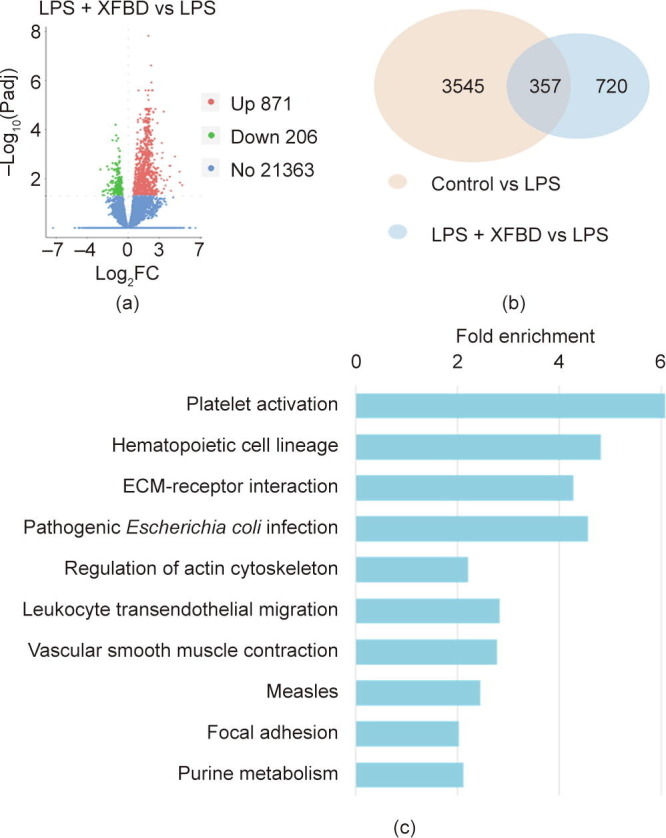
Fig. 3
Transcriptomic analysis suggested that XFBD regulates gene expression in multiple infection- and inflammation-related pathways. (a) Counts and distribution of differentially expressed genes (DEGs) of LPS-stimulated mice with or without XFBD treatment. Red: upregulated genes; green: downregulated genes; blue: genes without significant changes. Padj: adjust
Acknowledgments
This image is the copyrighted work of the attributed author or publisher, and
ZFIN has permission only to display this image to its users.
Additional permissions should be obtained from the applicable author or publisher of the image.
Full text @ Engineering (Beijing)