
- Title
-
Maintenance of quiescent oocytes by noradrenergic signals
- Authors
- Kim, J., Hyun, M., Hibi, M., You, Y.J.
- Source
- Full text @ Nat. Commun.
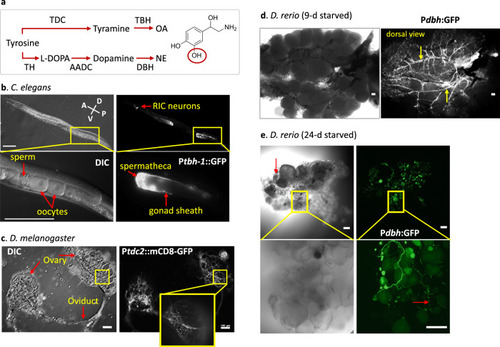
Noradrenergic innervation of ovaries in the three animals.
a The synthesis pathways of norepinephrine (NE) and octopamine (OA) and the enzymes for each step. TDC: Tyrosine decarboxylase, TBH: Tyramine β-hydroxylase, TH: Tyrosine hydroxylase, AADC: Aromatic L-amino acid decarboxylase, DBH: Dopamine β-hydroxylase, L-DOPA: L-Dihydroxyphenylalanine. NE is shown. The hydroxyl group (red circle) is absent in OA. b GFP driven by a tbh-1 promoter (Ptbh-1::GFP) is expressed in the gonadal sheath cells and the spermatheca in addition to RIC interneurons in the head of a 1-day old adult C. elegans. All 15 C. elegans examined showed similar expression pattern. The left panel shows developing oocytes surrounded by gonadal sheath (top) and the enlarged image of the inset in a DIC image (bottom). The right panel shows the GFP expression of tbh-1. The highest expression is observed in the spermatheca and the proximal three pairs of the gonadal sheath cells that surround diakinesis-staged oocytes. GFP is also expressed in a pair of RIC neurons in the head. c The expression of a tdc2-GAL4 reporter with a membrane targeting mCD8-GFP marks OA-expressing ovarian neurons originated from the abdominal nerves in a virgin female D. melanogaster. The neuronal branches cover the entire surface of the ovary. Similar tdc2-expression was observed from 18 flies. d EGFP driven by a dbh promoter is expressed in dbh-expressing neurons that surround the entire surface of the ovary in D. rerio. An image from a light microscopy shows many mature and growing oocytes in the ovary of 9-day starved zebrafish. The dbh-expressing nerves run along the main vasculatures on the dorsal side of the ovary (arrows). Similar dbh-expression was observed from 8 fish. e DIC and confocal images of the ovary of a 23-d-starved zebrafish. Degenerating oocytes are shown (red arrow). A higher magnification image (bottom) shows small-sized varicosities along the neurons (red arrow). Similar dbh-expression at lower magnification was observed from four fish. b–e Scale bar = 100 µm. |

Maintenance of quiescent oocytes by octopamine in C. elegans.
a Progress to Emo after sperm depletion (quiescent oocytes in green, Emo in red, the gap junctions between oocytes and sheath cells in blue). D: distal, P: proximal, Sp.: Spermatheca, Ut.: Uterus. b Representative images of DIC (left) and DAPI staining (right) of oocytes (rectangles: quiescent oocytes, polygons: oocytes, arrows: Emo). The images represent 84 gonad images of wild-type, 9 gonads of 62 h of tbh-1, 5 gonads of tdc-1, 94 gonads of 89 h of tbh-1, 77 gonads of tdc-1, 66 gonads of tbh-1 + OA, 66 gonads of tdc-1 + OA. c Representative images of antibody staining of activated MAPK in the proximal oocytes42. Staining frequency: 77% for wild-type (n = 35 gonads), 65% for tdc-1 (n = 17 gonads), and 70% for tbh-1 (n = 30 gonads). d Quantification of Emo at 89 h after hatch. Two-sided t-test: p = 0.001 (wild-type (n = 113 animals) vs. wild-type + OA (n = 99 animals)), 0.0003 (wild-type vs. wild-type + NE (n = 109 animals)), 0.0004 (tbh-1 (n = 132 animals) vs. tbh-1 + OA (n = 99 animals)), 0.035 (tbh-1 vs. tbh-1 + NE (n = 111 animals)), 0.001 (tdc-1 (n = 129 animals) vs. tdc-1 + OA (n = 103 animals)), 0.002 (tdc-1 vs. tdc-1 + NE (n = 86 animals)) (*p < 0.05, ** p < 0.005, ***p < 0.001). e A ser-3 mutant shows Emo. Transgenic lines (ser-3 TG, n = 14 gonads) rescue ser-3 mutants (n = 31 gonads). f, g The reproduction periods (f) and the total brood sizes calculated from f (g) of tbh-1 (n = 8 animals, two-sided t-test: p = 0.059), tdc-1 (n = 10 animals, p = 0.003) and ser-3 mutants (n = 9 animals, p = 0.623). p-value is vs. wild type. The mutants and wild-type (n = 8 animals) stop reproducing after 3 days as adults. Boxplots show the median, mean (X), interquartile range (IQR). The upper whisker: the maxima smaller than 1.5 times IQR plus the third quartile, the lower whisker: the minima larger than 1.5 times IQR minus the first quartile. b, c, e Scale bar = 20 μm. Source data are provided as a Source Data file. |
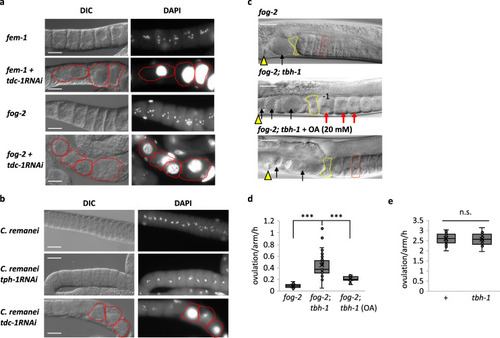
Maintenance of quiescent oocytes by octopamine in Caenorhabditis females.
a fem-1 and fog-2 mutants treated with control or tdc-1 RNAi. Each image represents the 20 − 40 gonad images. Red-dotted circle indicates individual Emo. b A C. remanei female treated with control RNAi or tdc-1 RNAi. tph-1 encodes a tryptophan hydroxylase. Similar images were observed from 33 gonads for an empty vector, 36 gonads for tph-1 RNAi and 23 gonads for tdc-1 RNAi. c In fog-2 mutants, 6 − 7 quiescent oocytes accumulate (red rectangle). Arrowheads: vulva, yellow polygons: spermatheca. In fog-2; tbh-1 mutants, no quiescent oocytes accumulate. Due to a faster ovulation rate than that of fog-2 mutants, three unfertilized oocytes in the uterus are shown (black arrows). The nucleus of the most proximal oocyte (−1) migrated to its cortex, indicating it is undergoing meiotic maturation23. Red arrows: activated oocytes. OA (20 mM) rescues the fog-2; tbh-1 phenotype. Two unfertilized oocytes are shown in the uterus due to delay of rescue (black arrows). All animals were virgins observed 10 h after late L4. Similar images were observed from 7 gonads for fog-2, 16 gonads for fog-2; tbh-1 and 9 gonads for fog-2; tbh-1 + OA. a–c Scale bar = 20 μm. d Ovulation rates of fog-2 (n = 28 animals), fog-2; tbh-1 (n = 71 animals) and fog-2; tbh-1 + OA (n = 35 animals). Two-sided t-test: p = 2.6 × 10⁻¹⁵ (***) for fog-2 vs. fog-2; tbh-1, 4.5 × 10⁻¹⁰ (***) for fog-2; tbh-1 vs. fog-2; tbh-1 + OA. e Wild-type (+) (n = 20 animals) and tbh-1 mutants (n = 14 animals) show similar ovulation rates in the presence of sperm. (n.s.: not significant, two-sided t-test: p = 0.76). d, e Boxplots show the median, mean (X), interquartile range (IQR). The upper whisker: the maxima smaller than 1.5 times IQR plus the third quartile, the lower whisker: the minima larger than 1.5 times IQR minus the first quartile. Source data are provided as a Source Data file. |
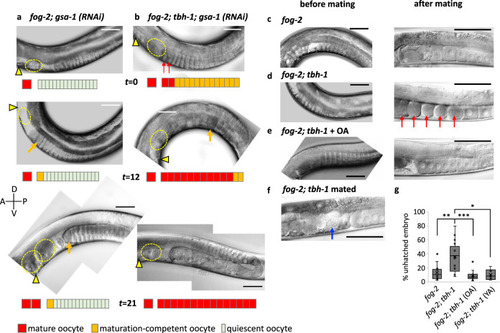
Octopamine acts in parallel to sperm signaling.
a, b OA negatively regulates ovulation in the absence of sperm signal independent of Gαs signaling. The ovulation process of a virgin of fog-2 with gsa-1 RNAi (a) or fog-2; tbh-1 with gsa-1 RNAi (b) was observed at 36 h (t = 0), 48 h (t = 12), and 57 h (t = 21) after the late L4 stage. Triangle indicates vulva, red arrows mature oocytes, and yellow dotted circle a matured oocyte ovulated in the uterus or trapped inside the spermatheca. At time point 0, oocytes were stacked in both fog-2; gsa-1RNAi and fog-2; tbh-1; gsa-1RNAi (n = 12 gonads for both). c–e Representative images of fog-2 and fog-2; tbh-1 before and after mating (5 h) and OA treated. Similar images were observed from 13 animals for fog-2, 12 animals for fog-2; tbh-1 and 11 animals for fog-2; tbh-1 + OA. Red arrow: Emo. f Mating does not produce Emo when late L4 females of fog-2; tbh-1 mutants (similar images were observed from 6 animals) were mated with wild-type males. We observed 98 ovulations occurring in 25 h (~30 min/ovulation/arm). Sperm are indicated by the blue arrow). a–f Scale bar = 50 μm. g Percent unhatched embryos. fog-2 (n = 400 embryos), fog-2; tbh-1 (n = 358 embryos), fog-2; tbh-1 (OA) (n = 948 embryos) and fog-2; tbh-1 (YA) (n = 437 embryos). Two-sided t-test: p = 0.0012 (**) for fog-2 vs. fog-2; tbh-1, p = 0.0001 (***) for fog-2; tbh-1 vs. fog-2; tbh-1 + OA, p = 0.28 for fog-2 vs. fog-2; tbh-1 + OA. Boxplots show the median, mean (X), interquartile range (IQR). The upper whisker: the maxima smaller than 1.5 times IQR plus the third quartile, the lower whisker: the minima larger than 1.5 times IQR minus the first quartile. Source data are provided as a Source Data file. |
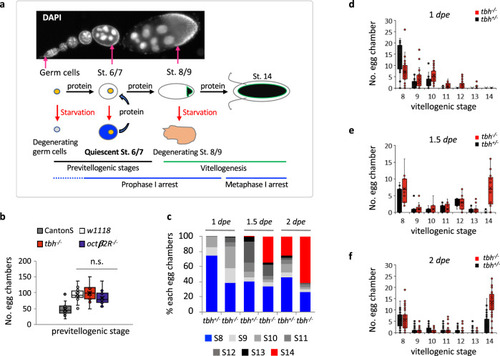
Octopamine is required for maintaining previtellogenic egg chambers upon nutrient deprivation in D. melanogaster.
a Oogenesis of D. melanogaster. Upon protein starvation, either germ cells or stage 8/9 egg chambers are degenerated. The previtellogenic egg chambers slow down the growth, then resume the growth within 2 h once protein is available. During egg chamber growth, meiotic chromosomes arrest at the prophase I until stage 13 (blue lines). b The number of previtellogenic egg chambers (stages 2–7) per fly are similar between wild-type (w1118) female virgin controls (n = 13 animals) and the octopamine mutant female virgins (tbh−/− (n = 11 animals) and octβ2R−/− (n = 14 animals)). Two-sided t-test: p = 0.63 (w1118 vs. tbh−/−), 0.22 (w1118 vs. octβ2R−/−), 0.12 (tbh−/− vs. octβ2R−/−). Canton-S (n = 35) has fewer number of egg chambers than w1118. p = 5.5 × 10⁻¹¹ (Canton-S vs. w1118), 1.7 × 10⁻¹⁰ (Canton-S vs. tbh−/−), 1.8 × 10⁻⁸ (Canton-S vs. octβ2R−/−). n.s.: not significant. c The percent of each stage of egg chambers in the ovaries of tbh+/− and tbh−/− virgins during the protein starvation period. The percent of stage 14 egg chambers increases in tbh−/− mutants compared to that of the heterozygote control, tbh+/−. These data are extracted from the raw data shown in d–f. d–f The distribution of each stage egg chambers in the ovaries of each tbh+/− (n = 29 animals for 1 dpe, 14 animals for 1.5 dpe, 59 animals for 2 dpe) and tbh−/− (n = 32 animals for 1 dpe; 17 animals for 1.5 dpe, 59 animals for 2 dpe) female virgin during the protein starvation period. At each time point, tbh−/− mutants contain more progressed egg chambers compared to tbh+/−. b, d–f Boxplots show the median, mean (X), interquartile range (IQR). The upper whisker: the maxima smaller than 1.5 times IQR plus the third quartile, the lower whisker: the minima larger than 1.5 times IQR minus the first quartile. Source data are provided as a Source Data file. |
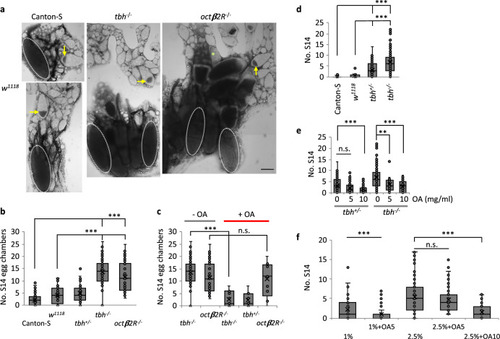
Octopamine regulates quiescence via Octβ2R, competing with nutrients.
a, b Upon protein starvation, tbh−/− or octβ2R−/− virgins contain more stage 14 egg chambers (S14, white dotted ellipses) than controls. Representative images (Scale bar = 100 µm) (a) and the quantification (b). Arrows indicate stage 9. n = 85 tbh−/−; 35 octβ2R−/−; 137 Canton-S; 52 w1118; 47 tbh+/−. Two-sided t-test: p = CS vs. w1118 (0.0001); vs. tbh+/− (1.2 × 10⁻⁶); vs. tbh−/− (8.4 × 10−36); vs. octβ2R−/− (1.4 × 10⁻¹⁰), w1118 vs. tbh+/− (0.21); vs. tbh−/− (2.6 × 10⁻²⁵); vs. octβ2R−/− (2.3 × 10⁻¹⁰); 7.2 × 10⁻²¹ (tbh−/− vs. tbh+/−); 8.8 × 10⁻⁷ (tbh+/− vs. octβ2R−/−); 0.070 (tbh−/− vs. octβ2R−/−). c Exogenous OA (5 mg/ml) rescues tbh−/− mutants, but not octβ2R−/−. n = 85 animals (−OA), 11 animals (+OA) for tbh−/−; 35 animals (−OA), 9 animals (+OA) for octβ2R−/−; 7 animals (+OA) for tbh+/−. Two-sided t-test: p = 7.5 × 10⁻⁹ for tbh−/−, 0.77 for octβ2R−/− between untreated and treated with OA. The same data for without OA in Fig. 6b was replotted. d Without nutrients, controls produce few S14 (n = 25 Canton-S, 11 w1118), whereas tbh−/− (n = 99 animals) produces at a similar rate to that of Canton-S fed on CSY. tbh+/− (n = 116 animals) produces S14 ranging between wild-type and tbh−/−. Two-sided t-test: p = CS vs. w1118 (0.05), vs. tbh+/− (3.1 × 10⁻⁶), vs. tbh−/− (1.7 × 10⁻¹⁰), w1118 vs. tbh+/− (0.008), vs. tbh−/− (4.4 × 10⁻⁵), 9.4 × 10⁻¹⁰ (tbh+/− vs. tbh−/−). e Exogenous OA restores oocyte quiescence to tbh+/− and tbh−/− in a concentration dependent manner. n = 33 tbh+/−, 28 tbh−/− for 5 mg/ml OA, 43 tbh+/−, 26 tbh−/− for 10 mg/ml OA. Two-sided t-test: p = 9.4 × 10⁻¹⁰ (tbh+/− vs. tbh−/−), 0.11 (tbh+/−: OA0 vs. OA5), 0.0005 (tbh+/−: OA0 vs. OA10), 0.0013 (tbh−/−: OA0 vs. OA5), 0.0001 (tbh−/−: OA0 vs. OA10). f OA and nutrients compete in regulation of egg chamber growth. n = 55 Canton-S (CSY1%), 73 Canton-S (1% + OA5), 107 Canton-S (CSY2.5%), 79 Canton-S (CSY2.5% + OA5), 53 Canton-S (CSY2.5% + OA10). Two-sided t-test: p = 0.0006 (CSY1% vs. CSY1% + OA5), 0.21 (CSY2.5% vs. CSY2.5% + OA5), 1.4 × 10⁻⁷ (CSY2.5% vs. CSY2.5% + OA10). b–f Numbers of egg chambers per fly were shown. Boxplots show the median, mean (X), interquartile range (IQR). The upper whisker: the maxima smaller than 1.5 times IQR plus the third quartile, the lower whisker: the minima larger than 1.5 times IQR minus the first quartile. Source data are provided as a Source Data file. |

NE is necessary for maintenance of quiescent oocytes during starvation.
a Follicle images of each stage of oocytes based on size and shape. b A representative image of an ovary of 24-d starved dbh+/− shows two major populations of oocytes of stage IV (dark and big, yellow circle) and stage I (transparent and small). Similar images were observed from 9 samples. c Images of three different ovaries of 24-d starved dbh−/−. In contrast to dbh+/−, most oocytes are stage II or III (intermediate size, red circle). Similar images were observed from 14 samples. d Upper panel: a representative image of an ovary of 24-d starved dbh+/− stained with neutral red. Stage I oocytes are most abundant (arrowheads). Oocytes in each stage of II, II* (late stage II), and IV are easily visible. Lower panel: an image of the whole ovary. e A representative image of an ovary of 32-d starved dbh−/−. Upper panel: neutral-red stained image. Compared to dbh+/−, oocytes of later stages (e.g., stages II and III) are abundant. Lower panel: an image of the whole ovary. b–e Scale bar = 200 μm. f The percent of oocytes at stage II (S2), late stage II (LS2), and stage III (S3) in dbh+/− (n = 8 sections from three independent fish) and dbh−/− (n = 10 sections from four independent fish). The stage III oocytes were only observed in dbh−/−. Two-sided t-test: p = 3.1 × 10⁻⁹ between dbh+/− vs. dbh−/− in stage II; p = 0.04 in late stage II; p = 0.0004 for stage III. g The sum of stage II, late stage II, and stage III oocytes presented in f. Two-sided t-test: p = 2.3 × 10⁻¹¹. f–g Boxplots show the median, mean (X), interquartile range (IQR). The upper whisker: the maxima smaller than 1.5 times IQR plus the third quartile, the lower whisker: the minima larger than 1.5 times IQR minus the first quartile. h Ovaries of four different dbh+/− females after 45 days of starvation contain only stage I oocytes. Ovaries of four other females showed similar phenotype. Scale bar = 100 μm. Source data are provided as a Source Data file. |
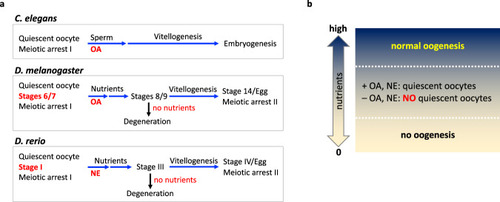
The model.
a The summary of oogenesis in different models shows the step and the stage where the noradrenergic input is required to maintain oocyte quiescence. Oocyte quiescence is maintained by OA. Quiescent oocytes are awakened by sperm in C. elegans and by nutrients in D. melanogaster. In zebrafish, NE would be overridden by nutrients, which serve as a signal of PFA. Under starvation conditions, early stage vitellogenic oocytes are subjected to degeneration in D. melanogaster and zebrafish. b For flies and zebrafish, oogenesis is tightly regulated by availability of food. When nutrients are completely deprived (0), oogenesis does not initiate due to lack of building blocks and energy. When nutrients are abundant (high), oogenesis progresses in full speed overriding any inhibitory signals such as NE/OA. When the nutrient level is insufficient for continuous oogenesis, NE/OA serves as a counterbalance signal to nutrients; oogenesis stops, and oocytes become quiescent waiting for the condition to be improved. |