
Fig. 6
- ID
- ZDB-FIG-211216-8
- Publication
- Kim et al., 2021 - Maintenance of quiescent oocytes by noradrenergic signals
- Other Figures
- All Figure Page
- Back to All Figure Page
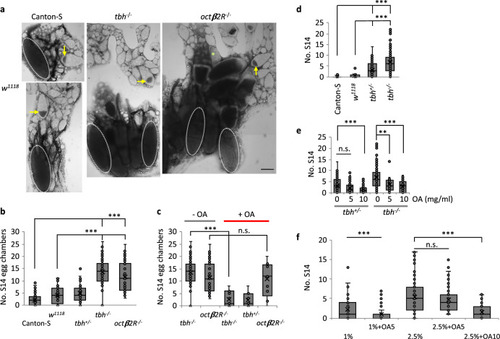
Octopamine regulates quiescence via Octβ2R, competing with nutrients.
a, b Upon protein starvation, tbh−/− or octβ2R−/− virgins contain more stage 14 egg chambers (S14, white dotted ellipses) than controls. Representative images (Scale bar = 100 µm) (a) and the quantification (b). Arrows indicate stage 9. n = 85 tbh−/−; 35 octβ2R−/−; 137 Canton-S; 52 w1118; 47 tbh+/−. Two-sided t-test: p = CS vs. w1118 (0.0001); vs. tbh+/− (1.2 × 10⁻⁶); vs. tbh−/− (8.4 × 10−36); vs. octβ2R−/− (1.4 × 10⁻¹⁰), w1118 vs. tbh+/− (0.21); vs. tbh−/− (2.6 × 10⁻²⁵); vs. octβ2R−/− (2.3 × 10⁻¹⁰); 7.2 × 10⁻²¹ (tbh−/− vs. tbh+/−); 8.8 × 10⁻⁷ (tbh+/− vs. octβ2R−/−); 0.070 (tbh−/− vs. octβ2R−/−). c Exogenous OA (5 mg/ml) rescues tbh−/− mutants, but not octβ2R−/−. n = 85 animals (−OA), 11 animals (+OA) for tbh−/−; 35 animals (−OA), 9 animals (+OA) for octβ2R−/−; 7 animals (+OA) for tbh+/−. Two-sided t-test: p = 7.5 × 10⁻⁹ for tbh−/−, 0.77 for octβ2R−/− between untreated and treated with OA. The same data for without OA in Fig. 6b was replotted. d Without nutrients, controls produce few S14 (n = 25 Canton-S, 11 w1118), whereas tbh−/− (n = 99 animals) produces at a similar rate to that of Canton-S fed on CSY. tbh+/− (n = 116 animals) produces S14 ranging between wild-type and tbh−/−. Two-sided t-test: p = CS vs. w1118 (0.05), vs. tbh+/− (3.1 × 10⁻⁶), vs. tbh−/− (1.7 × 10⁻¹⁰), w1118 vs. tbh+/− (0.008), vs. tbh−/− (4.4 × 10⁻⁵), 9.4 × 10⁻¹⁰ (tbh+/− vs. tbh−/−). e Exogenous OA restores oocyte quiescence to tbh+/− and tbh−/− in a concentration dependent manner. n = 33 tbh+/−, 28 tbh−/− for 5 mg/ml OA, 43 tbh+/−, 26 tbh−/− for 10 mg/ml OA. Two-sided t-test: p = 9.4 × 10⁻¹⁰ (tbh+/− vs. tbh−/−), 0.11 (tbh+/−: OA0 vs. OA5), 0.0005 (tbh+/−: OA0 vs. OA10), 0.0013 (tbh−/−: OA0 vs. OA5), 0.0001 (tbh−/−: OA0 vs. OA10). f OA and nutrients compete in regulation of egg chamber growth. n = 55 Canton-S (CSY1%), 73 Canton-S (1% + OA5), 107 Canton-S (CSY2.5%), 79 Canton-S (CSY2.5% + OA5), 53 Canton-S (CSY2.5% + OA10). Two-sided t-test: p = 0.0006 (CSY1% vs. CSY1% + OA5), 0.21 (CSY2.5% vs. CSY2.5% + OA5), 1.4 × 10⁻⁷ (CSY2.5% vs. CSY2.5% + OA10). b–f Numbers of egg chambers per fly were shown. Boxplots show the median, mean (X), interquartile range (IQR). The upper whisker: the maxima smaller than 1.5 times IQR plus the third quartile, the lower whisker: the minima larger than 1.5 times IQR minus the first quartile. Source data are provided as a Source Data file. |