FIGURE SUMMARY
Title

Identification of downstream effectors of retinoic acid specifying the zebrafish pancreas by integrative genomics

Authors
López-Pérez, A.R., Balwierz, P.J., Lenhard, B., Muller, F., Wardle, F.C., Manfroid, I., Voz, M.L., Peers, B.
Source
Full text @ Sci. Rep.

Effect of RA and BMS493 on the transcriptome of endodermal cells. (A) Principle component analysis (PCA) of the 24 RNA-seq data obtained on cells isolated at 3-somites stage (circle) and 8-somites stage (triangle). The colors indicate the data for non-endodermal cells (NE) (grey), and endodermal cells treated with RA (purple), BMS493 (red) and DMSO as control (green). The plot shows high reproducibility between triplicates. The strongest transcriptomic differences occur between endodermal and non-endodermal cell (along PC1), then between endodermal cells treated with RA and DMSO (along PC2), while BMS493 treatment has minimal influences. Consistent with the inverse-agonist action of BMS493 and with the agonist action of RA, these samples are located far from each other, the DMSO-samples being located between them. (B,C) Venn diagram displaying the number of genes up-regulated by RA (purple), down-regulated by BMS493 (red) and endodermal enriched (green) at 3-somites (B) and 8-somites stage (C).

Identification of RAR binding sites in the zebrafish endoderm. (A) Distribution of ChIP-seq peaks to the different regions of the zebrafish genome. (B) Top 3 motifs overrepresented in all ChIP-seq peak sequences with the percentage of sites containing the motifs and the p-value of enrichment. The three motifs consist to a repetition of the A/GGGTCA sequence; the first corresponds to the classical DR5 recognized by the RARA:RXR complex, the second (TR4) is a superposition of DR1 and DR2, and the third is a IR0. (C) Visualization of RARaa binding sites around the dhrs3a gene (upper panel), cyp26a1 (middle panel) and hoxb1a-hoxb4a genomic region (below panel). Tracks in gold correspond to RARaa ChIP-seq reads and identified RARaa peaks. The track in blue shows the location of conserved genomic sequences (from the UCSC Genome Browser obtained from comparison of 5 fish species).

Integrated analysis of the ChIP-seq and RNA-seq data. (A) Correlation of RA gene regulation (log2 fold change of expression RA versus DMSO) according to the number of neighbouring RARaa ChIP-seq peaks. Only RA-regulated genes were included in the plot. (B) Venn diagram showing the overlap of genes harbouring nearby RARa binding sites (yellow) and those up-regulated by RA (purple), or down-regulated by RA (blue). The below panel also shows the overlap with the genes down-regulated by BMS493 (red). The 13 genes showing up-regulation by RA, down-regulation by BMS493 and harbouring a RAR site are tshz1, nr6a1b, foxg1b, nr2f5, gata6, dhrs3a, hoxb1b, slc22a3, ppm1h, nrip1a, col7a1l, hoxc1a and hoxb5b.

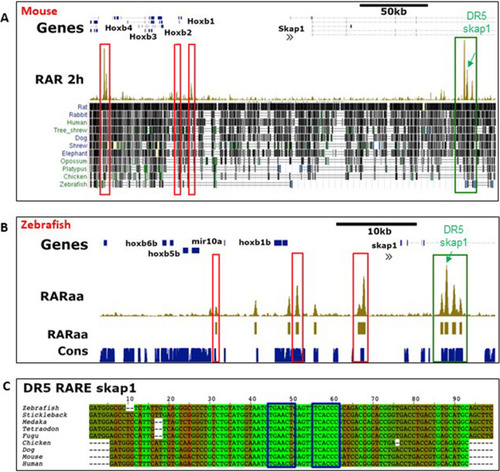
Examples of RARa binding sites conserved among vertebrates. (A,B) Genome browser views around HoxB-Skap1 locus in mouse (A) and zebrafish (B) showing the RAR binding sites detected by ChIP-seq (in gold) in both species. All RAR sites are located in CNEs but only the RAR sites located in skap1 gene 4th intron (green box) display sequence conservation from zebrafish to human. Other RAR sites located at similar places in the murine and zebrafish loci (red boxes) are probable orthologous RAR sites but their sequences cannot be aligned between zebrafish and mice. Conserved regions from the UCSC genome browser is shown below the murine RAR ChIP-seq peaks in panel (A). (C) Alignment of 9 vertebrate sequences corresponding to the second RAR sites located in skap1 gene 4th intron, showing the conservation of a DR5-like motif (blue boxes; inverse orientation) recognized by the RAR–RXR complex. Sequences highlighted in green are identical in all 9 species.

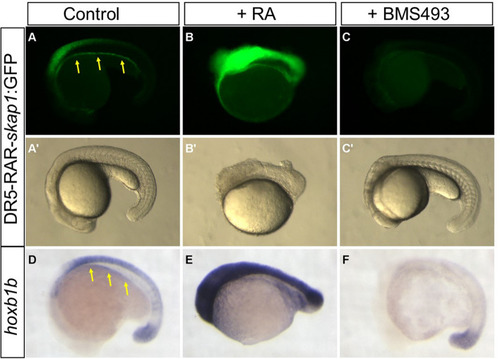
The conserved RAR site from skap1 gene 4th intron is a functional RARE. Pictures of the DR5-RAR-skap1:GFP transgenic embryos treated with DMSO (control, panel A), with RA (panel B) or with BMS493 (panel C). Upper panels display GFP fluorescent expression and lower panels (A′, B′ and C′) display embryo morphology. GFP Expression in the posterior endoderm gut is indicated by yellow arrows.

Identification of nucleosome-free regions in zebrafish endodermal cells and following RA treatments by ATAC-seq assays. (A) Heat maps showing enrichment of ATAC-seq reads at the middle of chromatin regions harbouring H3K4me3 and H3K27Ac epigenetic marks and at genomic areas corresponding to zCNE. The maps display intervals flanking 10 kb up and downstream of the features. The heat map plots shown on this figure corresponds to the ATAC-seq data obtained with control endodermal cells (DMSO-treated). Similar results were obtained for the other samples (see Suppl. Fig. 4). (B) PCA plots obtained for the ATAC-seq libraries. ATAC-seq data from endodermal and non-endodermal cells are separated along the PC2 axis, while those from RA-treated versus control and BMS493 are separated along the PC3 axis. The plot shows clustering of triplicates and no obvious separation of the DMSO- and BMS493- treated cells. (C,D) Top 3 enriched motifs found in nucleosome-free regions detected specifically in endoderm (C) and detected following RA-treatments (D). (E) Plot showing the correlation of RA-induced gene expression (log2 fold change) and the number of RA-induced nucleosome-free elements located nearby the genes. Only genes showing significant RA gene induction were included.

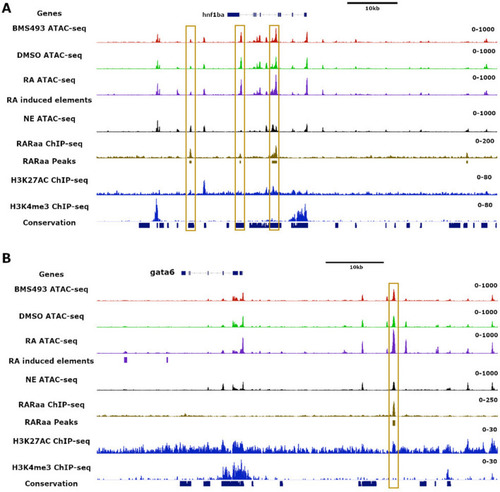
Location of RARa binding sites and of nucleosome-free regions in the hnf1ba (panel A) and gata6 (panel B) gene loci. Visualization of ATAC-seq reads from the merged 3 replicates obtained from endoderm treated with BMS493, DMSO or RA and from non-endodermal cells (NE), in addition to tracks showing RARaa binding sites, H3K27Ac and H3K3me3 marks determined by ChIP-seq. Regions showing conservation of genomic sequences among 5 fish species are also shown by blue boxes below the tracks. The RAR binding sites are highlighted by gold boxes.

Acknowledgments
This image is the copyrighted work of the attributed author or publisher, and ZFIN has permission only to display this image to its users. Additional permissions should be obtained from the applicable author or publisher of the image. Full text @ Sci. Rep.