IMAGE

Figure 3

ID
ZDB-IMAGE-211201-32
Source
Figures for López-Pérez et al., 2021
Image
Figure Caption

Figure 3

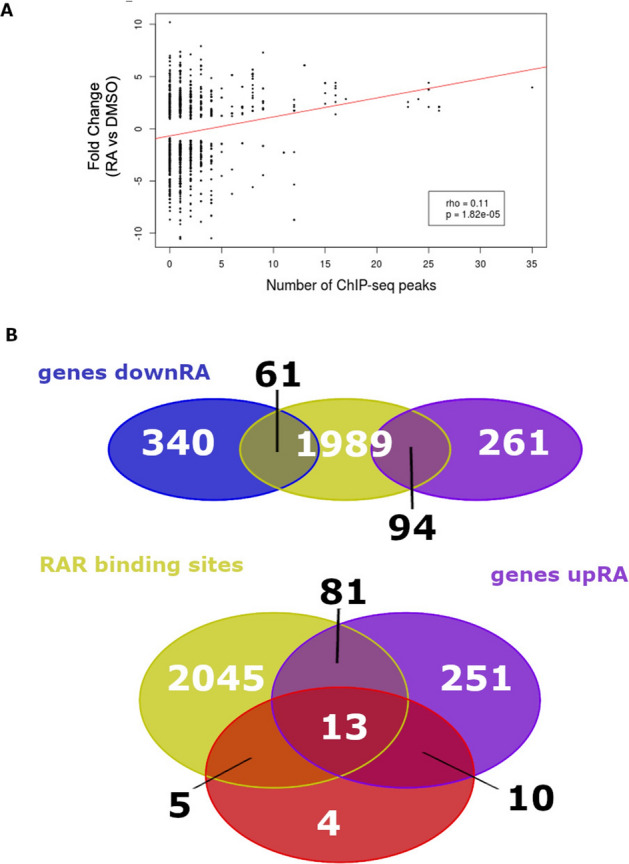
Integrated analysis of the ChIP-seq and RNA-seq data. (A) Correlation of RA gene regulation (log2 fold change of expression RA versus DMSO) according to the number of neighbouring RARaa ChIP-seq peaks. Only RA-regulated genes were included in the plot. (B) Venn diagram showing the overlap of genes harbouring nearby RARa binding sites (yellow) and those up-regulated by RA (purple), or down-regulated by RA (blue). The below panel also shows the overlap with the genes down-regulated by BMS493 (red). The 13 genes showing up-regulation by RA, down-regulation by BMS493 and harbouring a RAR site are tshz1, nr6a1b, foxg1b, nr2f5, gata6, dhrs3a, hoxb1b, slc22a3, ppm1h, nrip1a, col7a1l, hoxc1a and hoxb5b.

Acknowledgments
This image is the copyrighted work of the attributed author or publisher, and ZFIN has permission only to display this image to its users. Additional permissions should be obtained from the applicable author or publisher of the image. Full text @ Sci. Rep.